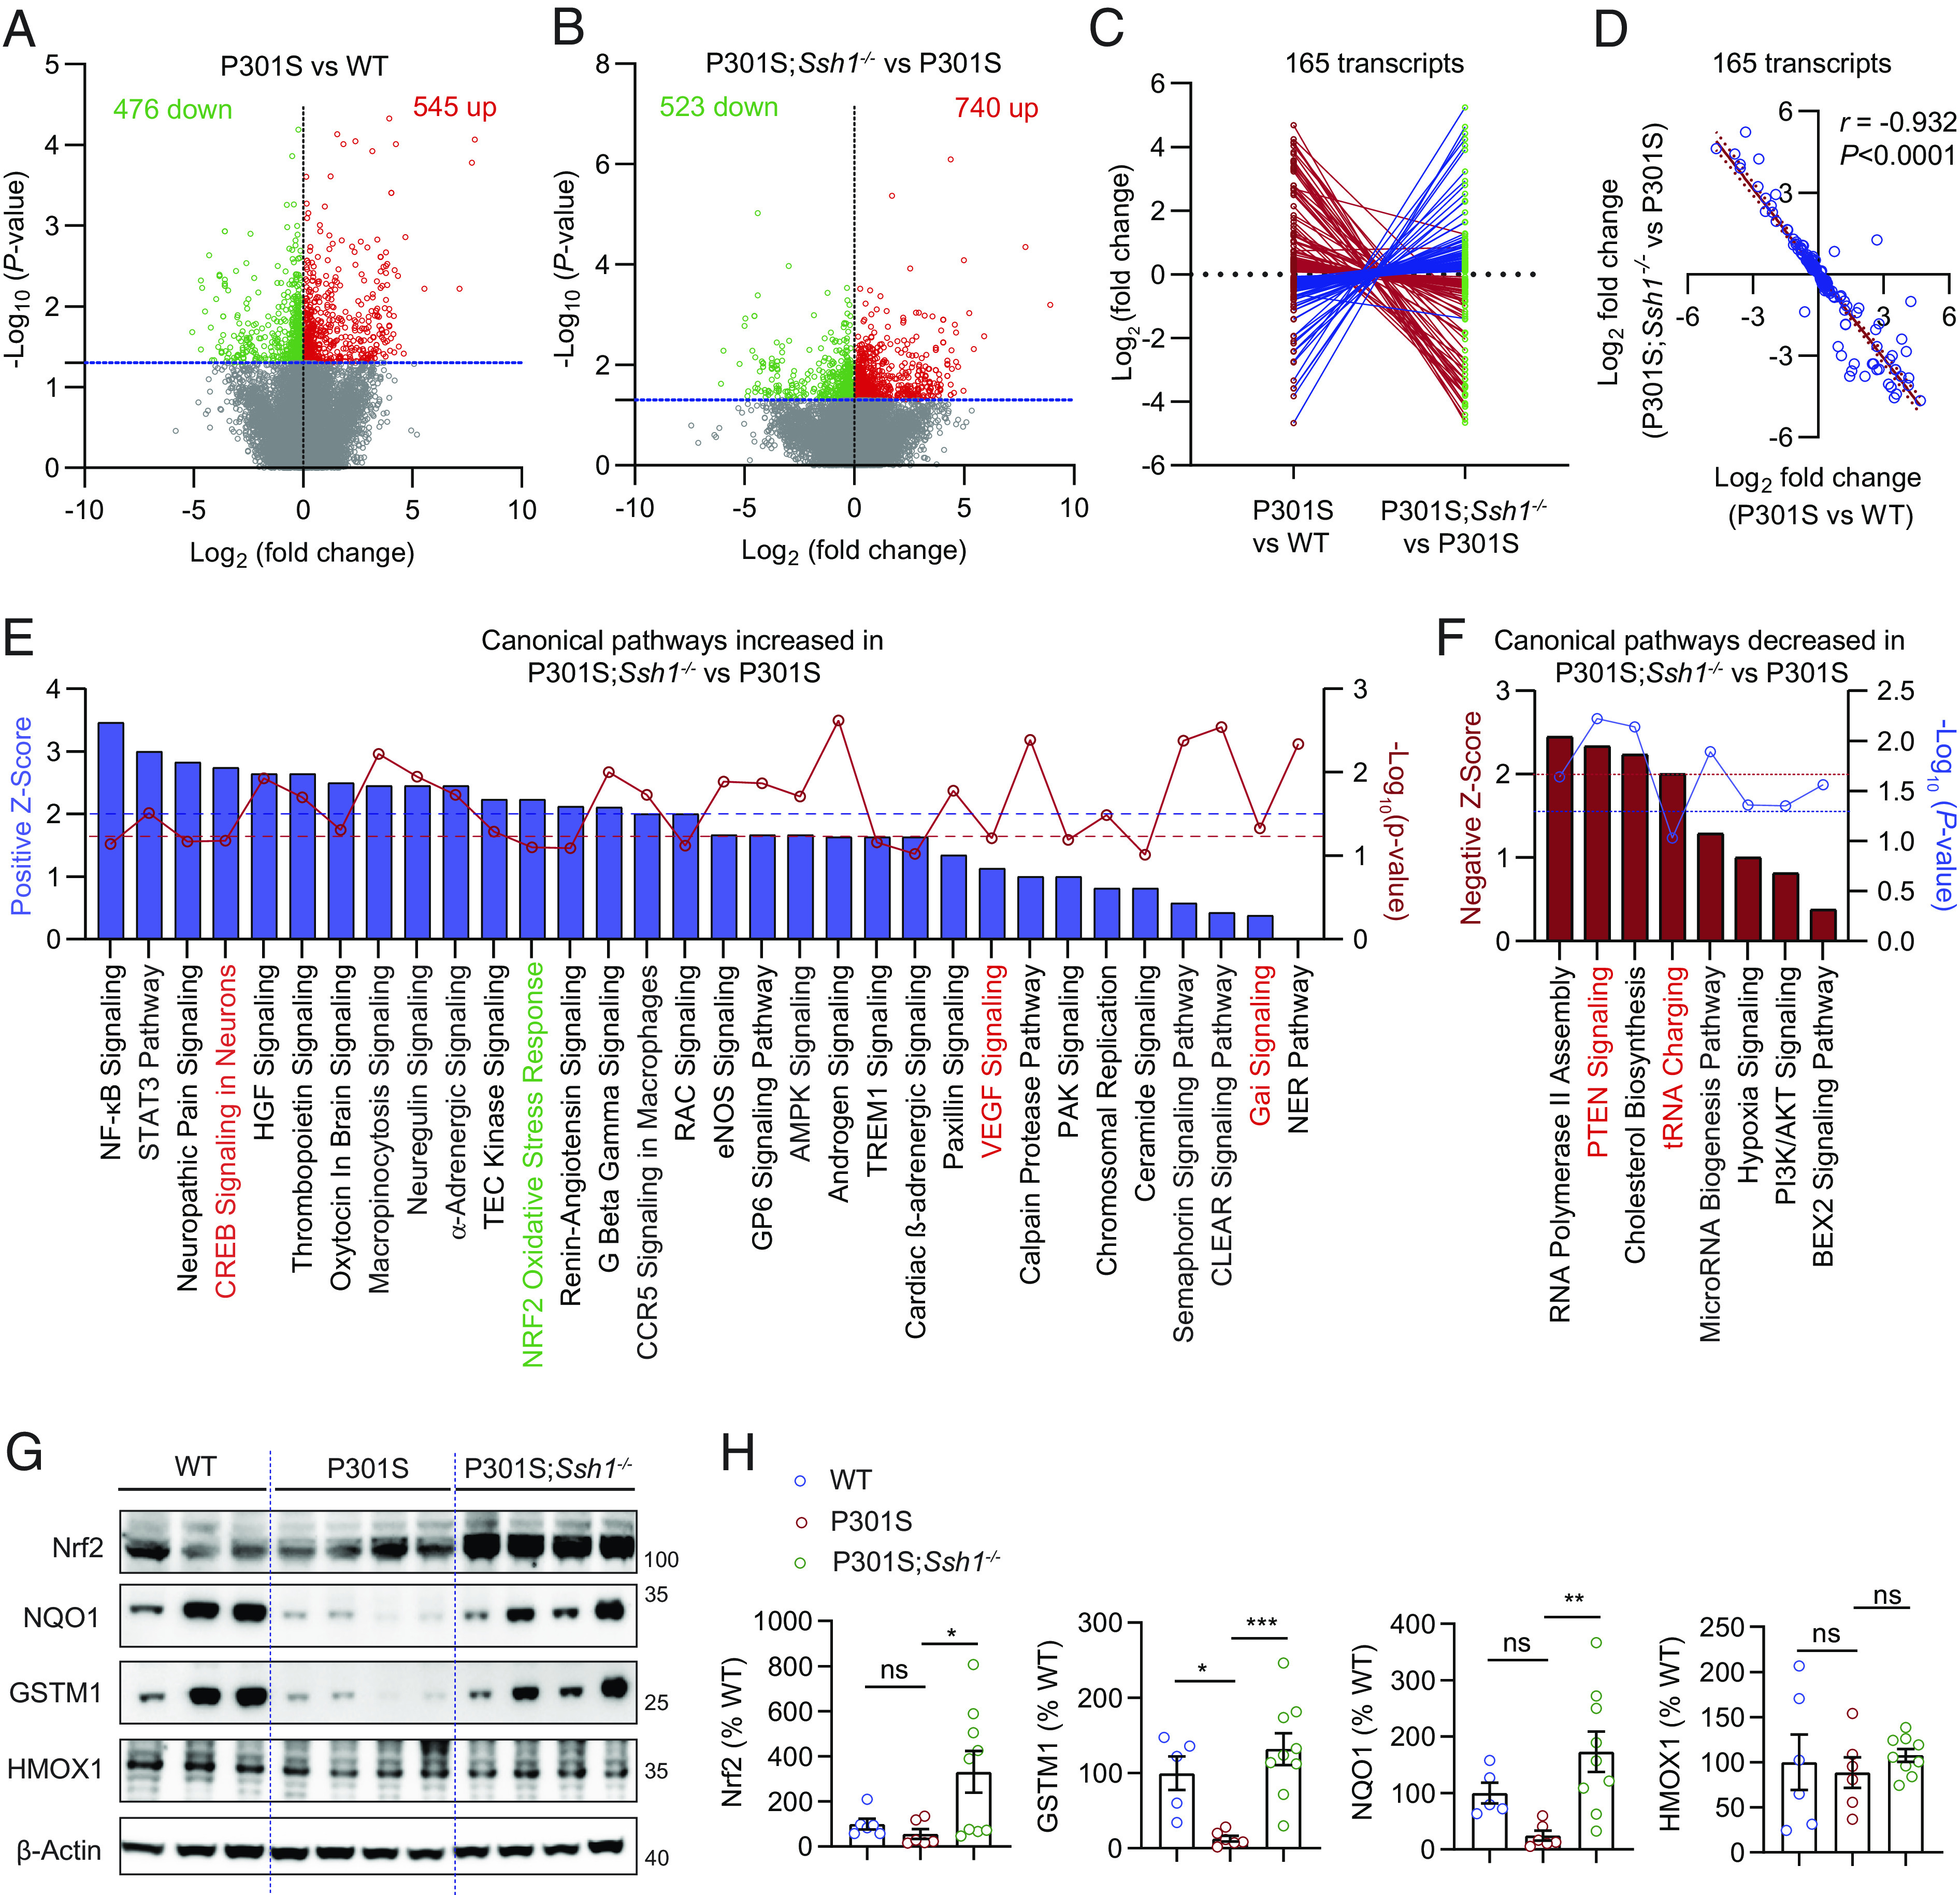
Fig. 6.

Ssh1 elimination normalizes transcriptomic perturbations in tauP301S mice and activates the Nrf2 pathway. (A and B) Volcano plots of differentially expressed genes (DEGs) based on RNA-seq of transcripts in the cortex of 7-mo-old (A) P301S mice compared to WT mice and (B) P301S;Ssh1−/− mice compared to P301S mice. Log2 (fold change) is plotted against -Log10(P-value) with the dotted blue line representing nominal significance (≥1.3). Each circle represents one transcript, with red circles showing significant upregulation and green circles showing significant downregulation (n = 3 to 4 mice/genotype). (C and D) Of all common transcripts significantly altered in P301S mice relative to WT mice and in P301S;Ssh1−/− mice relative to P301S mice (165 transcripts), (C) butterfly line graph shows 160 transcripts normalize expression in the reverse direction in P301S;Ssh1−/− compared to P301S mice. (D) Spearman correlation analysis of Log2 fold changes of transcripts in P301S relative to WT mice and Log2 fold changes in P301S;Ssh1−/− relative to P301S mice shows a steep negative correlation (r = −0.932, P < 0.0001). (E) Qiagen® Ingenuity® pathway analysis (IPA) showing top canonical pathways increased in the cortex of P301S;Ssh1−/− mice compared to P301S mice, plotted by Z-score (blue bars) and -Log10(P-value) (red circles). Dotted blue line (≥2) = significant pathway activation Z-score. Dotted red line (≥1.3) = significant adjusted -Log10(P-value) for overlap of genes in each pathway. (F) IPA showing top canonical pathways decreased in the cortex of P301S;Ssh1−/− mice compared to P301S mice, plotted by negative Z-score (red bars) and -Log10(P-value) (blue circles). Dotted red line (≥2) = significant pathway activation Z-score. Dotted blue line (≥1.3) = significant adjusted -Log10(P-value) for overlap of genes in each pathway. (G) Representative blots of Nrf2 and Nrf2 targets (NQO1, GSTM1, & HMOX1) from cortical lysates of 7-mo-old WT, P301S, and P301S;Ssh1−/− mice. (H) Quantification of Nrf2, NQO1, GSTM1, and HMOX1 [one-way ANOVA; Nrf2: F (2, 18) = 4.645, P = 0.0236; NQO1: F (2, 17) = 6.763, P = 0.0069; GSTM1: F (2, 17) = 10.35, P = 0.0011; HMOX1: F (2, 18) = 0.2911, P = 0.7509; post hoc Dunnett, ***P = 0.0006, **P = 0.0037, *P < 0.05. n = 5 to 9 mice/genotype].
