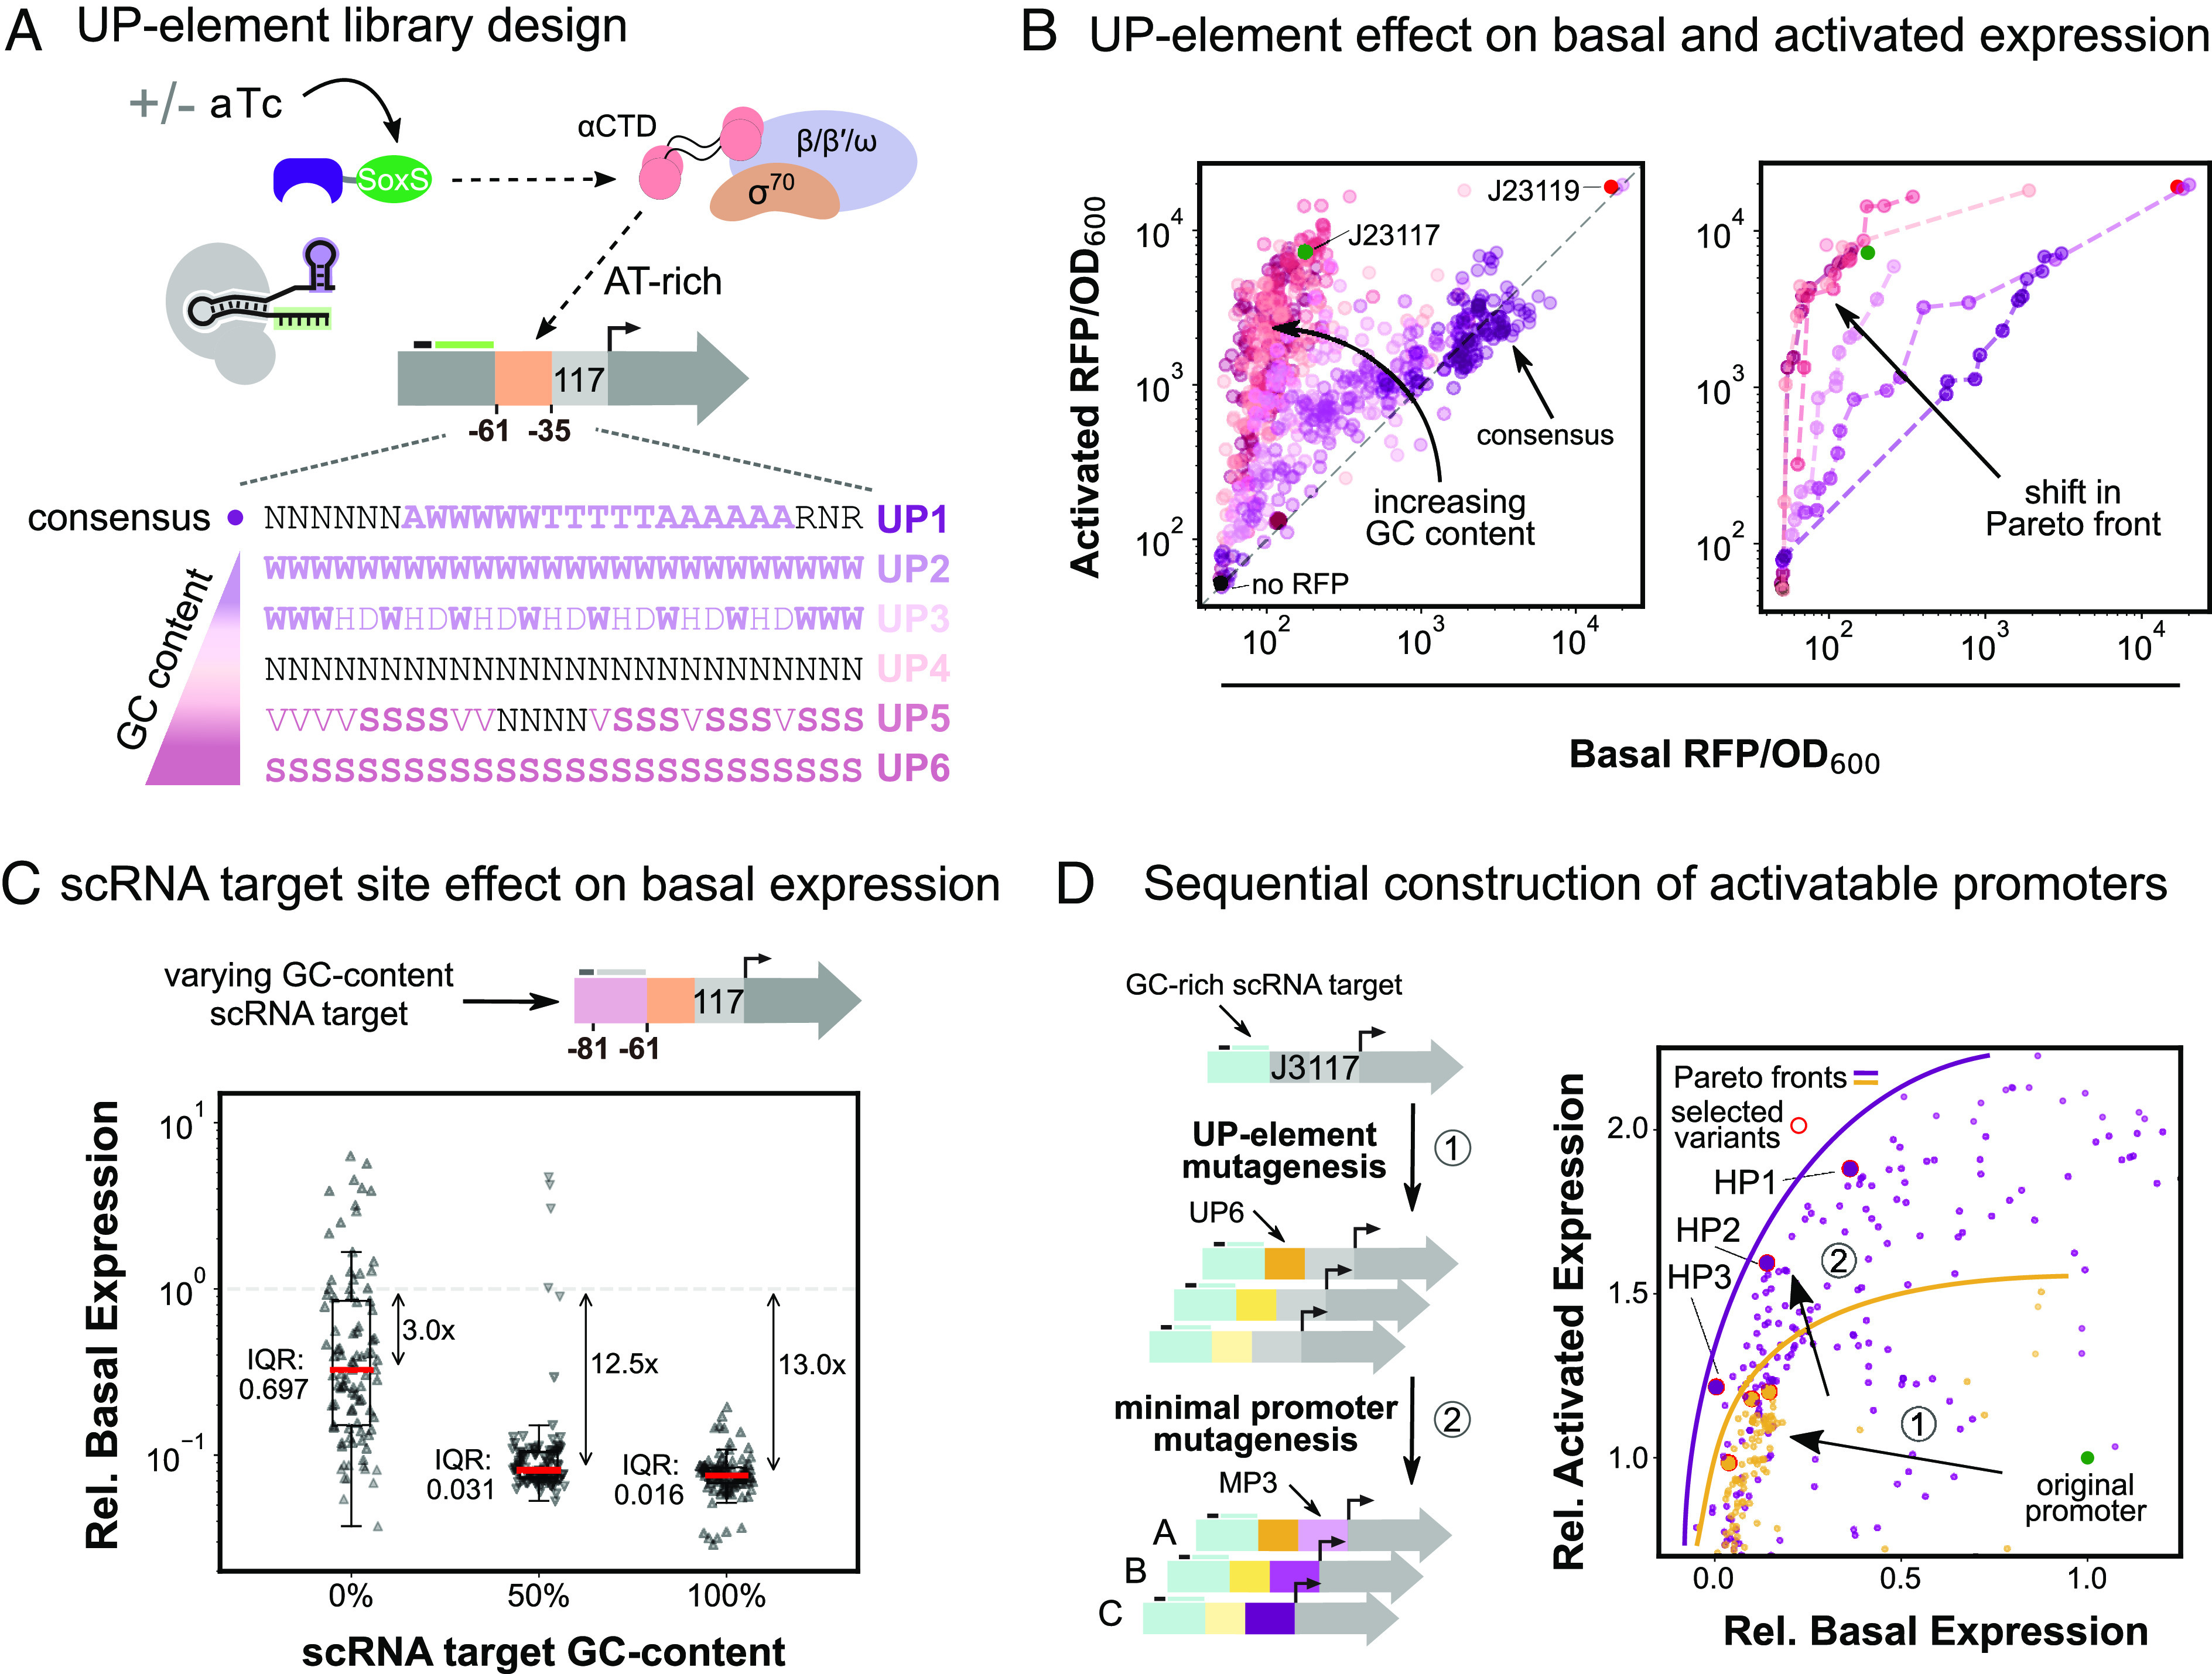
Fig. 2.

Combining promoter regions to engineer high-performing CRISPRa promoters. (A) Schematic of RNAP interactions with the UP element and library design. α-CTD affinity for AT-rich UP elements upstream of the minimal promoter helps recruit RNAP. Upon targeting with CRISPRa, UP element RNAP recruitment contributions are largely replaced by SoxS-RNAP α-CTD interactions. UP element libraries with increasing GC content were designed to minimize α-CTD interactions (Methods S11). (B) UP element GC content effect on expression levels is shown through activated and basal RFP/OD600 for the six UP element libraries (nUP1 = nUP2 = … = nUP6 = 110). Left: Increasing GC content in the UP element lowers the range of the basal expression level, while maintaining the full range of activated expression levels. The gray dash line defines promoter variants with equal activated and basal expression levels. Right: Colored dash lines define the Pareto front for each UP element library (SI Appendix, Methods S3). Increasing the UP element GC content effectively shifts the Pareto front toward lower basal expression levels. (C) scRNA target site composition effect on basal expression. Comparison of three scRNA libraries with increasing GC content (nS1 = nS2 = nS3 = 93) (Methods S11). Basal expression levels are normalized to the standard J3 promoter basal expression level. Red lines indicate the median expression level of each distribution. The interquartile range is calculated as the difference between the upper and lower quartiles and measures the spread of the distribution. (D) Sequential construction of activatable promoters. Left: Activatable promoters were constructed by sequential library mutagenesis screens starting from the J3 promoter with a GC-rich scRNA target site. Three Pareto optimal UP elements were selected after promoter mutagenesis with a GC-rich UP element library (1). We then mutagenized the minimal promoter of the three previously selected variants (2) and again selected three Pareto optimal variants. Right: Basal and activated expression levels for all mutagenesis variants normalized to the standard J3 promoter expression levels (green). Yellow points represent variants from the UP element mutagenesis (nUP6 = 192) (1), while purple points represent variants from the minimal promoter mutagenesis (nMP3 = 279) (2). Red circles indicate selected variants from each screen, and solid lines depict the Pareto optimal fronts. Each sequential mutagenesis led to variants with both lower basal and higher activated expression levels.
