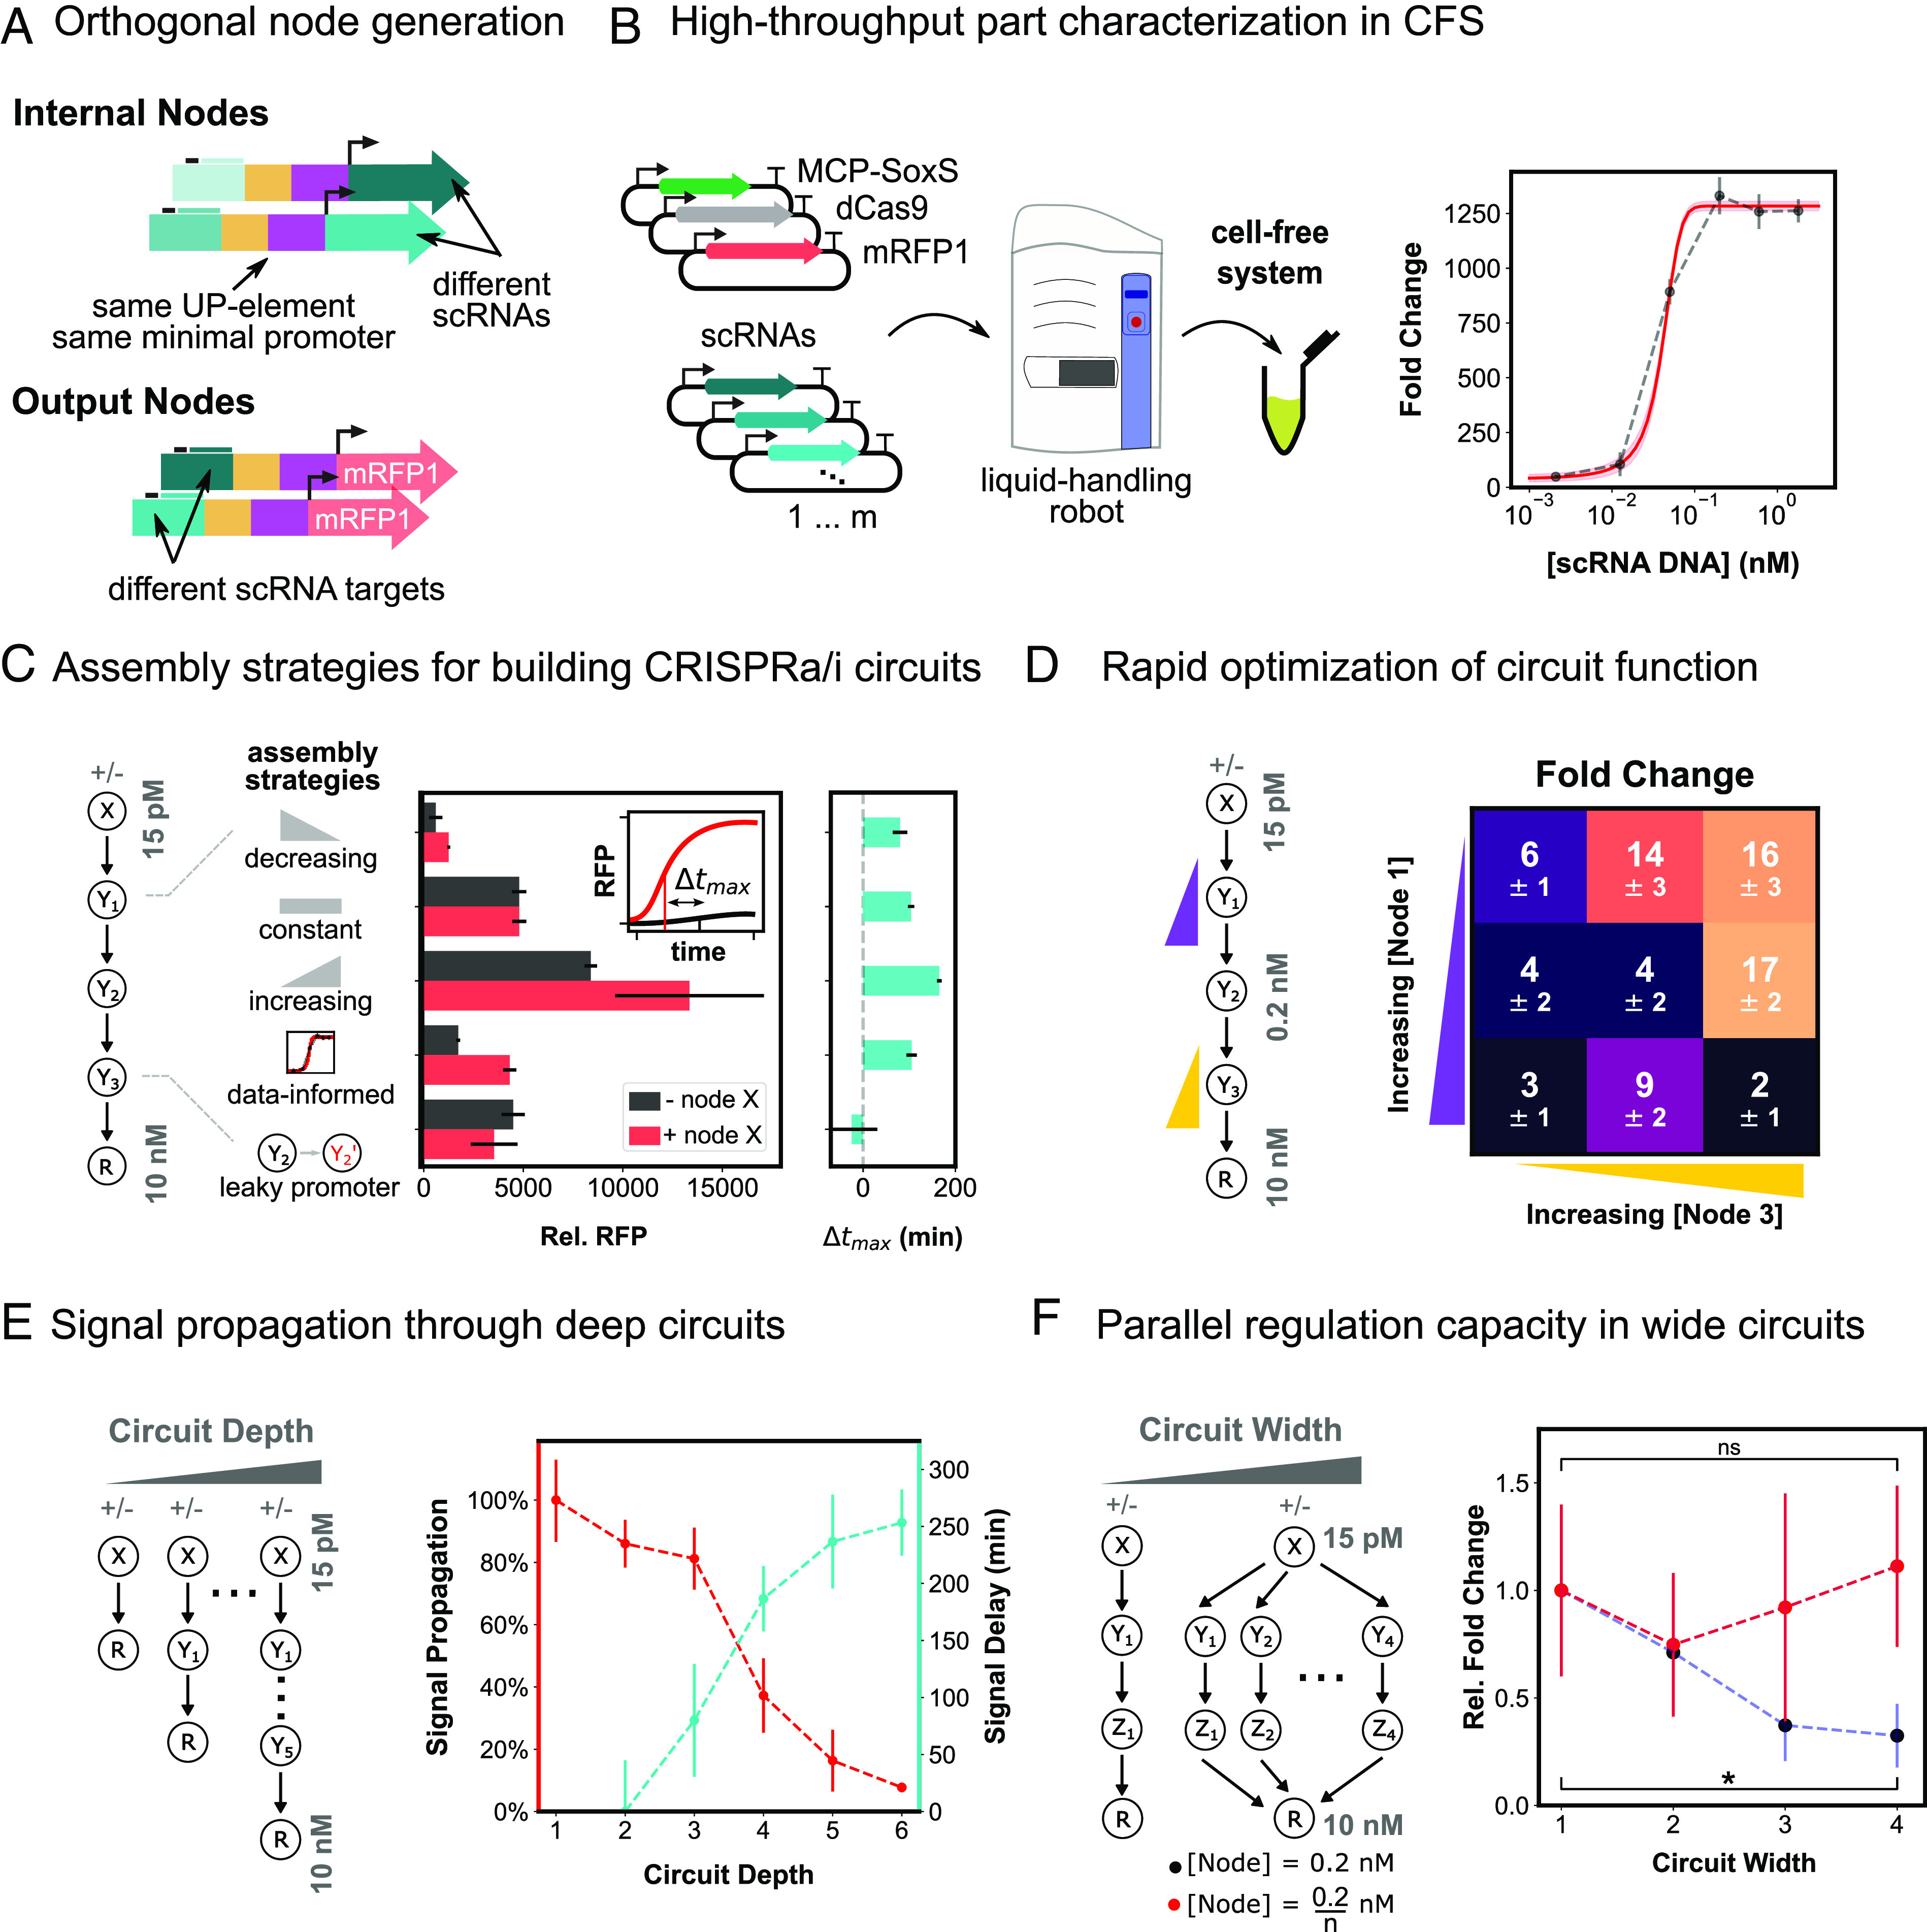
Fig. 3.

Engineering deep and wide circuits with high-performing CRISPRa promoters. (A) Schematic of orthogonal CRISPRa/i nodes for use in cell-free circuits. Internal nodes contain an orthogonal scRNA target site and express orthogonal scRNAs. Output nodes contain orthogonal scRNA target sites and express RFP. All nodes contain the same UP element and minimal promoter (HP3). (B) High-throughput characterization of scRNA components in CFS. Left: Plasmids encoding each CRISPRa component are mixed using an acoustic liquid handling robot and expressed in CFS. Right: scRNA-dose–response curves for each node are generated by titrating the amount of scRNA plasmid from 0.5 pM to 5 nM. (C) Comparison of assembly strategies for building a four-layer CRISPRa cascade. Left: Internal node concentrations either decreased from 200 pM to 32 pM as depth increased, were held constant at 200 pM, or increased from 200 pM to 1.25 nM as depth increased. A fourth assembly method was tested in which internal node concentrations were 40, 200, and 170 pM, based on individual scRNA-dose response characteristics. A fifth cascade was included in which the high-performing promoter of the second internal node was replaced with the leaky J2 promoter. Input and output node concentrations were held constant across all strategies at 0 or 15 pM and 10 nM, respectively. Center: Cascade output RFP expression for each assembly strategy with scRNA input (red) and without (black), relative to RFP basal expression. Right: Change in time to maximum expression rate (Δtmax) for each assembly strategy (SI Appendix, Methods S3). (D) Rapid fold change optimization of a four-layer CRISPRa cascade. Left: The first and third internal nodes of the cascade were varied between 40 and 160 pM and 85 and 340 pM, respectively. The input node, second internal node, and output node were held constant at 0 or 15 pM, 0.2 nM, and 10 nM, respectively. Right: Fold change between with and without scRNA input for each CRISPRa cascade. (E) Signal propagation through deep CRISPRa/i circuits. Left: CRISPRa cascades with increasing depth. Input and output node concentrations were held constant across all cascades at 0 or 15 pM and 10 nM, respectively. All of the parallel cascade scRNA outputs are connected to the same RFP node. All node concentrations are tabulated in SI Appendix, Table S5. Right: Propagation efficiency and signal delay are shown as a function of circuit depth (SI Appendix, Methods S3). (F) Construction of wide CRISPRa/i circuits. Left: CRISPRa cascades with increasing width. Input and output node concentrations were held constant across all cascades at 0 or 15 pM and 10 nM, respectively. Right: The concentration of each internal node was held at 0.2 nM as circuit width increased (blue), or the internal node concentration was scaled down proportionally to the width of the circuit (red), such that each internal node concentration is 0.2/n nM, where n is the number of parallel cascades. Fold activation is given relative to a single CRISPRa cascade (SI Appendix, Methods S3). For all panels, values represent the mean ± SD of three technical replicates.
