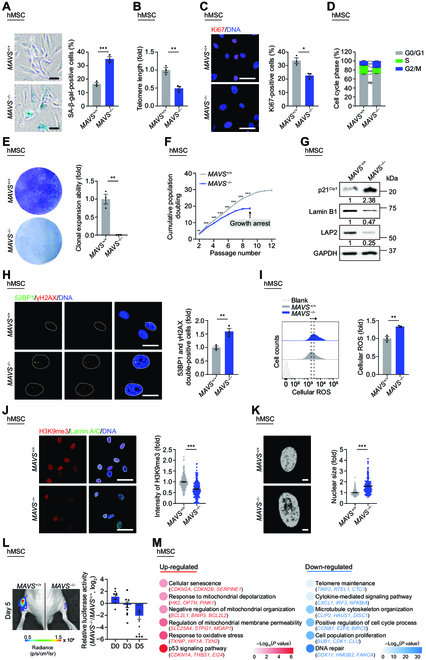
Fig. 2.

Depletion of MAVS accelerates cellular senescence of hMSCs. (A) SA-β-gal staining of MAVS+/+ and MAVS−/− hMSCs at LP (P8). Scale bar, 50 μm. Data are presented as the means ± SEM. n = 3 biological replicates. ***, P < 0.001 (t test). (B) Telomere length analysis of MAVS+/+ and MAVS−/− hMSCs at LP (P8) by qPCR. Data are presented as the means ± SEM. n = 3 technological replicates. **, P < 0.01 (t test). (C) Immunofluorescence staining of Ki67 in MAVS+/+ and MAVS−/− hMSCs at LP (P8). Scale bar, 50 μm. Data are presented as the means ± SEM. n = 3 biological replicates. *, P < 0.05 (t test). (D) Bar plot of cell cycle analysis in MAVS+/+ and MAVS−/− hMSCs at LP (P8). Data are presented as the means ± SEM. n = 3 biological replicates. ns, not significant; **, P < 0.01; ***, P < 0.001 (t test). (E) Clonal expansion analysis of MAVS+/+ and MAVS−/− hMSCs at LP (P8). Data are presented as the means ± SEM. n = 3 biological replicates. **, P < 0.01 (t test). (F) Growth curves of MAVS+/+ and MAVS−/− hMSCs. Data are presented as the means ± SEM. n = 3 biological replicates. **, P < 0.01; ***, P < 0.001 (t test). (G) Western blotting analysis of aging-related markers p21Cip1, Lamin B1, and LAP2 in MAVS+/+ and MAVS−/− hMSCs at LP (P8). GAPDH was used as a loading control. The numbers below represent relative protein levels. The statistical analysis is shown in Fig. S2E. (H) Immunofluorescence staining of 53BP1 and γH2AX in MAVS+/+ and MAVS−/− hMSCs at LP (P8). Scale bar, 25 μm. Data are presented as the means ± SEM. n = 3 biological replicates. **, P < 0.01 (t test). (I) FACS analysis of total cellular ROS levels by staining with the free radical sensor H2DCFDA in MAVS+/+ and MAVS−/− hMSCs at middle passage (MP, P6). Dashed lines indicate the position of mean fluorescent intensity (MFI). Cells unstained were used as the blank control. Data are presented as the means ± SEM. n = 3 biological replicates. **, P < 0.01 (t test). (J) Left: Immunofluorescence staining of H3K9me3 and Lamin A/C in MAVS+/+ and MAVS−/− hMSCs at LP (P8). Scale bar, 50 μm. Right: Statistical analysis of mean fluorescence intensity of H3K9me3. n = 200 cells. ***, P < 0.001 (t test). (K) Left: Nuclear DNA staining in MAVS+/+ and MAVS−/− hMSCs at LP (P8). Scale bar, 10 μm. Right: Statistical analysis of nuclear size. n = 180 cells. ***, P < 0.001 (t test). (L) Analysis of luciferase activities in TA muscles of immunodeficient mice transplanted with MAVS+/+ (left) or MAVS−/− hMSCs (right) at MP (P6) at Day 0, 3, and 5 after implantation. Data calculated by the ratios of log2(MAVS−/−/MAVS+/+) are presented as the means ± SEM. n = 8 mice. *, P < 0.05; ***, P < 0.001 (t test). (M) Point plot showing GO terms and pathways enriched by up-regulated (red) and down-regulated (blue) DEGs between MAVS+/+ and MAVS−/− hMSCs at LP (P8). The color keys from gray to red or blue indicate low to high enrichment levels.
