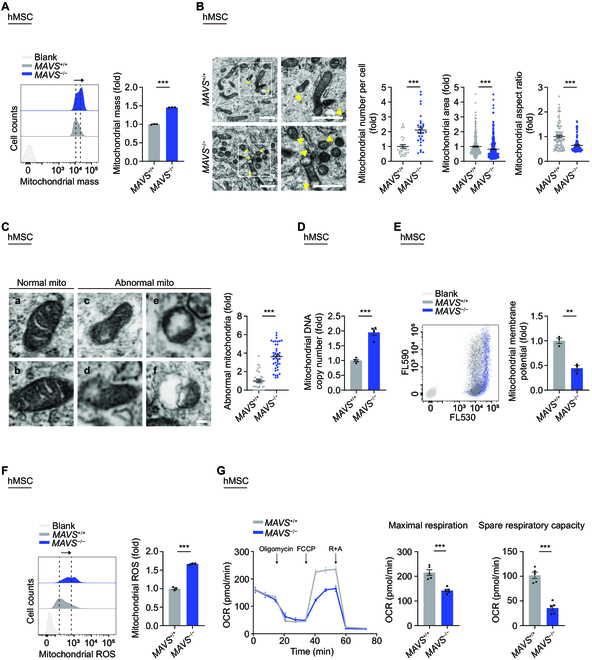
Fig. 3.

MAVS deficiency compromises mitochondrial dynamics. (A) FACS analysis of mitochondrial mass levels in MAVS+/+ and MAVS−/− hMSCs at LP (P8). Dashed lines indicate the position of MFI. Cells unstained were used as the blank control. Data are presented as the means ± SEM. n = 3 biological replicates. ***, P < 0.001 (t test). (B) Left: TEM analyses of mitochondrial number, mitochondrial area and aspect ratio in MAVS+/+ and MAVS−/− hMSCs at MP (P6). Yellow arrows indicate abnormal mitochondria. Scale bar, 1 μm. Right: Statistical analyses of mitochondrial number per intact cell, mitochondrial area, and aspect ratio. Data are presented as the means ± SEM. n = 30 cells; n = 300 mitochondria; n = 100 mitochondria. ***, P < 0.001 (t test). (C) Left: Micrographs of normal (a and b) and abnormal (c to f) mitochondria (“mito” indicates mitochondria). The former had typical morphology, and the latter showed severe disorganization of the membrane, including extensive loss of cristae, decreased electron density of the matrix, and dissolution and “bleb” formation. Scale bar, 100 nm. Right: Statistical analysis of relative percentage of abnormal mitochondria. Data are presented as the means ± SEM. n = 40 images to determine the relative percentage of abnormal mitochondria in each sample. ***, P < 0.001 (t test). (D) qPCR analysis of mtDNA copy number in MAVS+/+ and MAVS−/− hMSCs at LP (P8). Data are presented as the means ± SEM. n = 4 technological replicates. ***, P < 0.001 (t test). (E) FACS analysis of mitochondrial membrane potential in MAVS+/+ and MAVS−/− hMSCs at LP (P8) using a fluorescence probe JC-10. Cells unstained were used as the blank control. Data are presented as the means ± SEM. n = 3 biological replicates. **, P < 0.01 (t test). (F) FACS analysis of mitochondrial ROS levels by MitoSOX red staining in MAVS+/+ and MAVS−/− hMSCs at LP (P8). Dashed lines indicate the position of MFI. Cells unstained were used as the blank control. Data are presented as the means ± SEM. n = 3 biological replicates. ***, P < 0.001 (t test). (G) Detection of the OCR in MAVS+/+ and MAVS−/− hMSCs at MP (P6) in response to indicated mitochondrial modulators by Seahorse analysis. Maximal respiration and spare respiratory capacity were calculated by the OCR values. Data are presented as the means ± SEM. n = 5 biological replicates. ***, P < 0.001 (t test).
