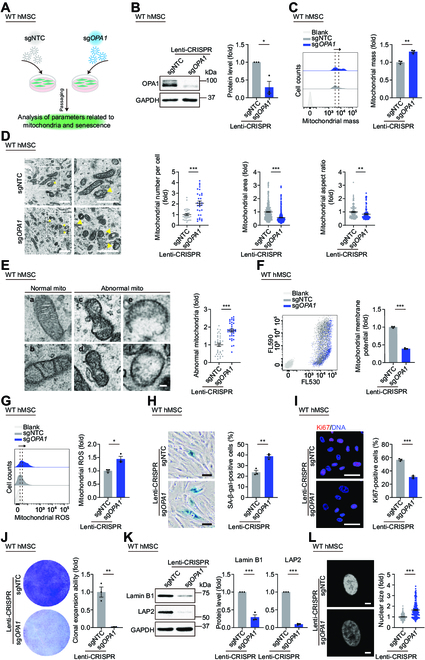
Fig. 5.

Impaired OPA1 contributes to the loss of mitochondrial homeostasis and cellular senescence. (A) Schematic workflow showing lentivirus infection mediating OPA1 knockdown in WT hMSCs at P7. (B) Western blotting analysis of OPA1 in WT hMSCs at P7 transduced with lentiviruses expressing sgNTC or sgOPA1 via CRISPR/Cas9 system. GAPDH was used as a loading control. Data are presented as the means ± SEM. n = 3 biological replicates. *, P < 0.05 (t test). (C) FACS analysis of mitochondrial mass levels in WT hMSCs at P7 transduced with lentiviruses expressing sgNTC or sgOPA1 via CRISPR/Cas9 system. Dashed lines indicate the position of MFI. Cells unstained were used as the blank control. Data are presented as the means ± SEM. n = 3 biological replicates. **, P < 0.01 (t test). (D) Left: TEM analyses of mitochondrial number, mitochondrial area and aspect ratio in WT hMSCs at P7 transduced with lentiviruses expressing sgNTC or sgOPA1 via CRISPR/Cas9 system. Yellow arrows indicate abnormal mitochondria. Scale bar, 1 μm. Right: Statistical analyses of mitochondrial number per intact cell, mitochondrial area, and aspect ratio. Data are presented as the means ± SEM. n = 30 cells; n = 300 mitochondria; n = 100 mitochondria. **, P < 0.01; ***, P < 0.001 (t test). (E) Left: Micrographs of normal (a and b) and abnormal (c to f) mitochondria (“mito” indicates mitochondria). Scale bar, 100 nm. Right: Statistical analysis of relative percentage of abnormal mitochondria. Data are presented as the means ± SEM. n = 35 images to determine the relative percentage of abnormal mitochondria in each sample. ***, P < 0.001 (t test). (F) FACS analysis of mitochondrial membrane potential in WT hMSCs at P7 transduced with lentiviruses expressing sgNTC or sgOPA1 via CRISPR/Cas9 system using a fluorescence probe JC-10. Cells unstained were used as the blank control. Data are presented as the means ± SEM. n = 3 biological replicates. ***, P < 0.001 (t test). (G) FACS analysis of mitochondrial ROS levels by MitoSOX red staining in WT hMSCs at P7 transduced with lentiviruses expressing sgNTC or sgOPA1 via CRISPR/Cas9 system. Dashed lines indicate the position of MFI. Cells unstained were used as the blank control. Data are presented as the means ± SEM. n = 3 biological replicates. *, P < 0.05 (t test). (H) SA-β-gal staining in WT hMSCs at P7 transduced with lentiviruses expressing sgNTC or sgOPA1 via CRISPR/Cas9 system. Scale bar, 50 μm. Data are presented as the means ± SEM. n = 3 biological replicates. **, P < 0.01 (t test). (I) Immunofluorescence staining of Ki67 in WT hMSCs at P7 transduced with lentiviruses expressing sgNTC or sgOPA1 via CRISPR/Cas9 system. Scale bar, 50 μm. Data are presented as the means ± SEM. n = 3 biological replicates. ***, P < 0.001 (t test). (J) Clonal expansion analysis in WT hMSCs at P7 transduced with lentiviruses expressing sgNTC or sgOPA1 via CRISPR/Cas9 system. Data are presented as the means ± SEM. n = 3 biological replicates. **, P < 0.01 (t test). (K) Western blotting analysis of aging-related markers Lamin B1 and LAP2 in WT hMSCs at P7 transduced with lentiviruses expressing sgNTC or sgOPA1 via CRISPR/Cas9 system. GAPDH was used as a loading control. Data are presented as the means ± SEM. n = 3 biological replicates. ***, P < 0.001 (t test). (L) Left: Nuclear DNA staining in WT hMSCs at P7 transduced with lentiviruses expressing sgNTC or sgOPA1 via CRISPR/Cas9 system. Right: Statistical analysis of nuclear size. Scale bar, 10 μm. Data are presented as the means ± SEM. n = 180 cells. ***, P < 0.001 (t test).
