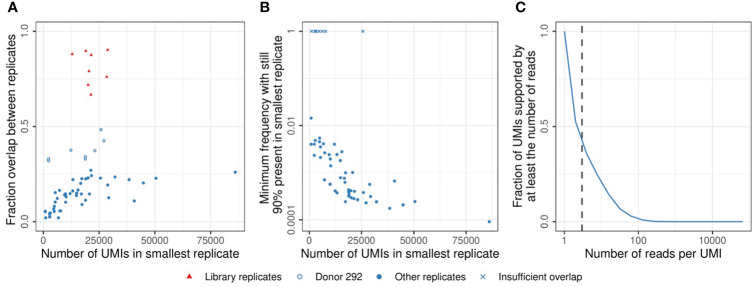
Figure 4.
Sample overlap and coverage. (A). Fraction of the sample overlapping between two replicates from the same time point (see Methods). Comparisons between multiple samples of sorted cells (blue circles) and replicates generated by sequencing the same TCRβ library twice (red triangles). The open blue circles indicate samples from donor 292, which have a relatively high overlap due to a low TCRβ diversity (see also Figure S3). (B). TCRβ frequency in the largest replicate at which sequences start missing in the smallest replicate (see Methods). X marks indicate comparisons in which the most abundant TCRβ sequence did not overlap between both samples. (C). Cumulative frequency of the UMI-coverage, plotted as the fraction of UMIs supported by at least a given number of reads (horizontal axis). The vertical dashed line indicates a coverage of 3 reads per UMI, which was used as the minimum support to take a sequence into account in the analysis (see Methods).

