
Figure 1.
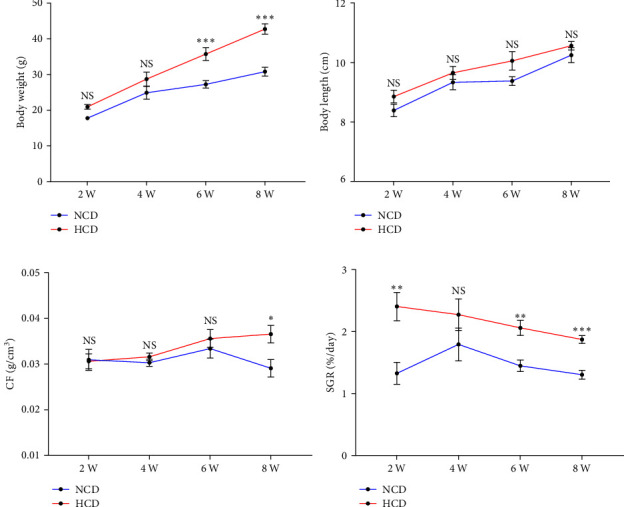
The growth performance of gibel carp fed with HCD and NCD during 8 weeks. (a) Body weight, (b) body length, (c) condition factor (CF), and (d) specific growth rate (SGR). Values are expressed as means ± SEMs, n = 9. ∗, ∗∗, ∗∗∗Different from NCD: ∗P < 0.05, ∗∗P < 0.01, and ∗∗∗P < 0.005, NS means no significant difference (two-tailed independent t test).