
Figure 6.
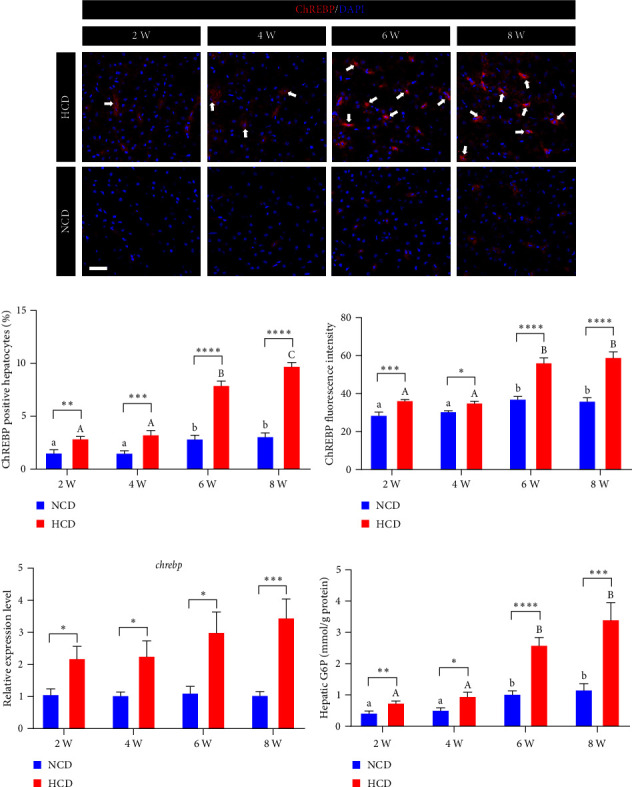
The expression and activation levels of hepatic G6P-ChREBP signal in gibel carp fed with HCD and NCD during 8 weeks. (a) Represented ChREBP (red) staining images (scale bar = 30 μm), (b) percentage of nuclear ChREBP positive hepatocytes, (c) average fluorescence intensity of nuclear ChREBP, (d) expression level of hepatic chrebp, and (e) hepatic glucose-6-phosphate (G6P) content. Values are expressed as means ± SEMs, n = 6. Labeled means without a common letter differ among 2 W, 4 W, 6 W, and 8 W (lowercase for NCD, uppercase for HCD), P < 0.05 (one-way ANOVA, Duncan's post hoc test). ∗, ∗∗, ∗∗∗, ∗∗∗∗Different from NCD: ∗P < 0.05, ∗∗P < 0.01, ∗∗∗P < 0.005, ∗∗∗∗P < 0.001, NS means no significant difference (two-tailed independent t test).