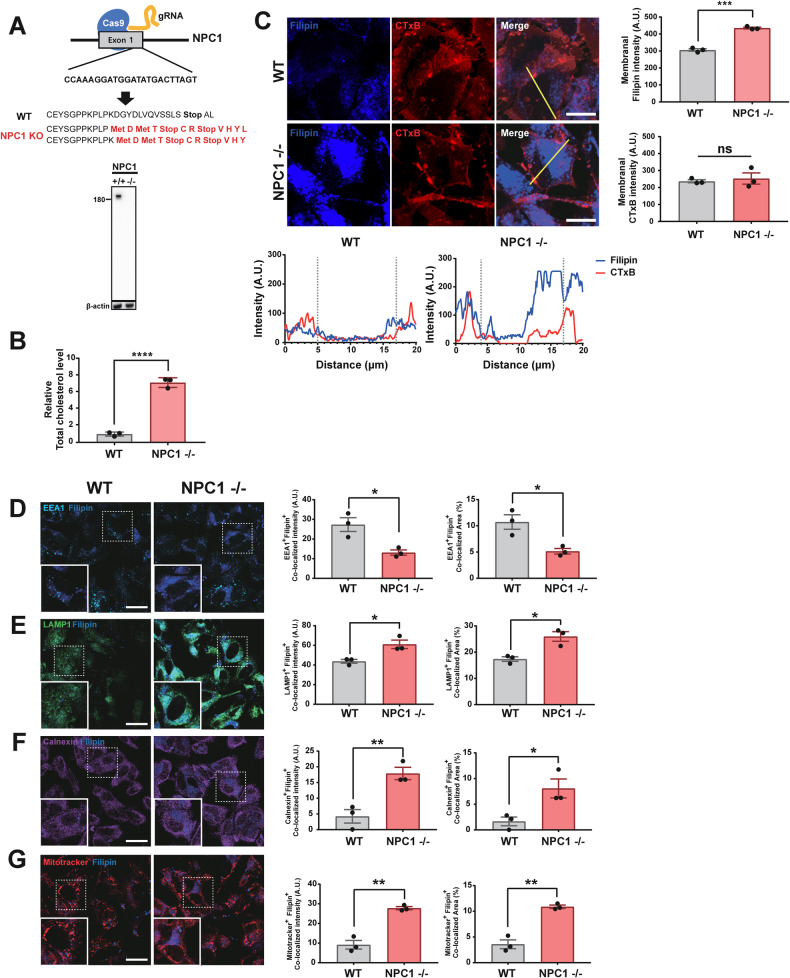
Fig. 3. Characterization and analysis of cholesterol levels in NPC1-KO cells.
A Construction of the NPC1-KO cell line using the CRISPR-Cas9 system. Scheme for NPC1 knockout (top) and representative Western blot (bottom). B Intracellular total cholesterol levels in NPC1-KO cells and WT (LAMP1-GFP) cells. C Analysis of the plasma membranal cholesterol levels in WT and NPC1-KO cells. Filipin marks cholesterol, and cholera toxin B (CTxB) binds GM1 and marks the lipid rafts mostly in the plasma membrane. Yellow lines in the confocal images indicate the distance analyzed for the graphs below. Graphs on the right show the levels of filipin and CTxB binding in the plasma membrane. D–G Analysis of cholesterol distribution in intracellular organelles, such as early endosome (D), late endosome/lysosome (E), endoplasmic reticulum (F), and mitochondria (G). Colocalization of filipin staining with EEA1 (early endosome antigen 1) (D), LAMP1 (Lysosomal-associated membrane protein 1) (E), calnexin (F), and mitotracker (G) were analyzed. Colocalization was expressed as either colocalized fluorescence intensity (left graphs) or colocalized area (right graphs). All data are presented as means ± SEM (*p < 0.05, **p < 0.005, ***p < 0.0005, ****p < 0.0001; two-tailed unpaired Student’s t-test).

