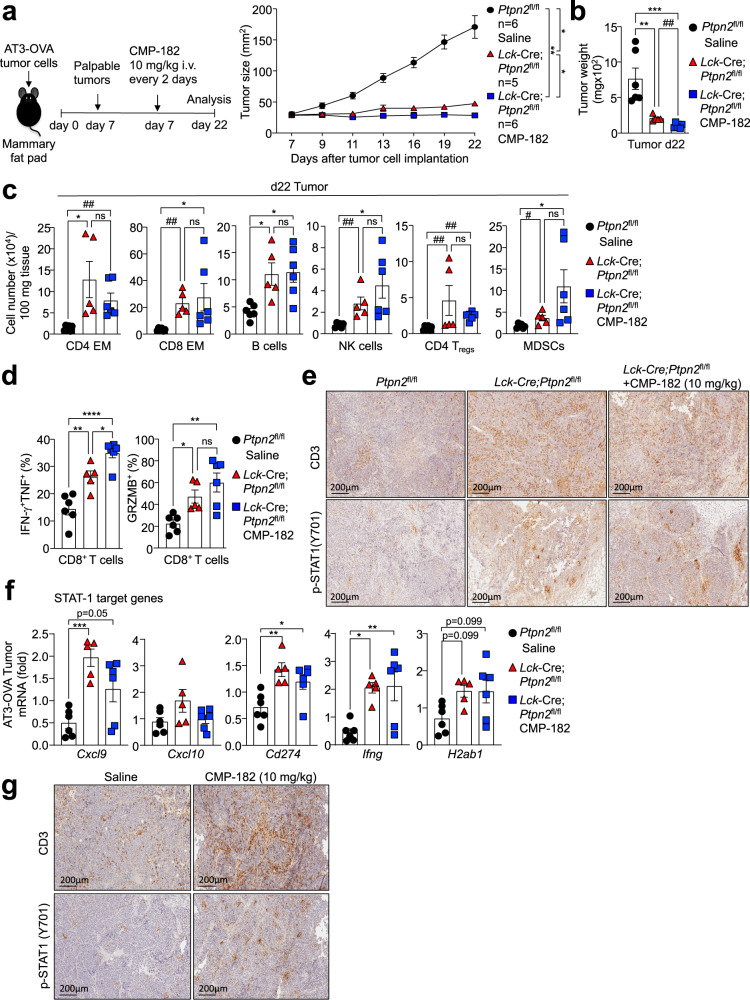
Fig. 7. Effects of Compound 182 on AT3-OVA mammary tumor growth, STAT-1 signaling and T cell infiltrates in Lck-Cre;Ptpn2fl/fl mice.
a–f AT3-OVA mammary tumor cells were injected into the fourth inguinal mammary fat pads of 8 week-old Ptpn2fl/fl (n = 6) and Lck-Cre;Ptpn2fl/fl (C57BL/6) (n = 5-6 in each group) female mice. Mice were treated with Compound 182 (CMP-182; 10 mg/kg i.v.; n = 6) or saline (n = 6) on days (d) 7, 9, 11, 13, 15, 17, 19 and 21 after tumor cell implantation. a Tumor growth was monitored and b tumor weights were measured. c Tumor-infiltrating lymphocytes including CD44hiCD62Llo CD8+ and CD4+ effector/memory (EM) T cells, CD19+ B cells, NK1.1+TCRβ− (NK) cells, CD4+CD25+FoxP3+ regulatory T cells (Tregs) and granulocytic and monocytic CD11b+F4/80hi/loLy6C+Ly6G+/−myeloid-derived suppressor cells (MDSCs) were analyzed by flow cytometry. d Tumor-infiltrating T cells from (a) were stimulated with PMA/Ionomycin in the presence of Golgi Stop/Plug and stained for intracellular IFN-γ and TNF. Intracellular granzyme B (GRZMB) was detected in unstimulated tumor-infiltrating CD8+ T cells. AT3-OVA tumors were processed for e immunohistochemistry staining for p-STAT-1, or CD3 (counterstained with hematoxylin) or f qPCR monitoring for the expression of STAT-1 target genes. g AT3-OVA mammary tumor cells were injected into the fourth inguinal mammary fat pads of C57BL/6 mice. Mice were treated with CMP-182 (10 mg/kg i.v.) or saline on days 6, 8, 10, 12, 14, 16, 18, and 21 after tumor cell implantation; the resultant tumor growth curves are shown in Fig. 4a. The resulting AT3-OVA tumors were processed for immunohistochemistry staining for STAT-1 Y701 phosphorylation (p-STAT-1), or CD3 (counterstained with hematoxylin). In (a–d, f) representative results (means ± SEM) from at least two independent experiments are shown. In (e, g) micrographs are representative of two independent experiments with 5 mice per group. Significance for tumor sizes in (a) was determined using a 2-way ANOVA Test and for tumor weights in (b) using a 1-way ANOVA Test. In (c, d) significances were determined using a 1-way ANOVA Test and a 2-tailed Mann–Whitney U Test (#p < 0.05, ##p < 0.01) where indicated. In (f) significances were determined using a 1-way ANOVA Test.

