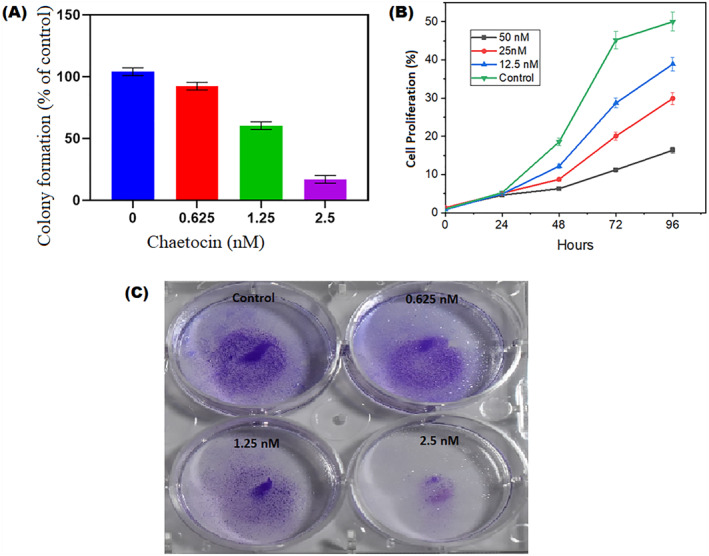
FIGURE 1.

(a) Chaetocin inhibits A549 cell colony forming unit at different concentrations (b) Real time cell analysis of A549 cells inhibition after chaetocin treatment at different days and different concentrations. (c) A549 cells treated with different concentration of chaetocin (0.625, 1.25 and 2.5 nM) and colony formation. Results presented here are representative of three independent experiments. Results in (a and b) are shown as mean ± SD of three independent experiments. *P < 0.01 versus control group.
