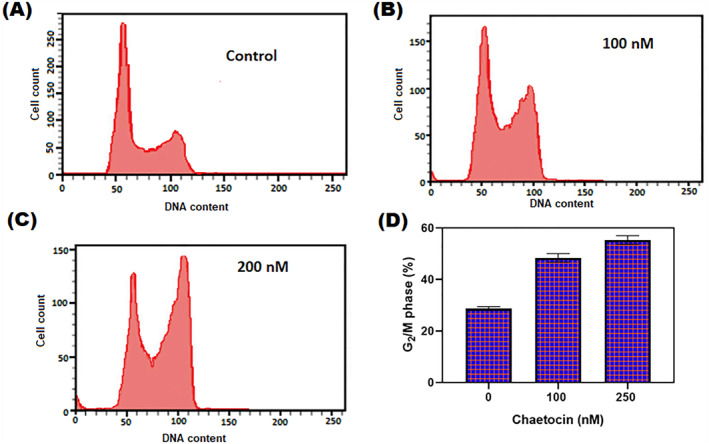
FIGURE 2.

(a–c) The cell cycle distribution of A5549 cells 12 h with chaetocin treatment at different doses (100 and 200 nM) by PI‐staining (d) Depression of G2/M phase with chaetocin treatment at various concentrations. Results were shown as mean ± SD of triplicate experiments. *p < 0.05 versus control cells.
