
FIGURE 5.
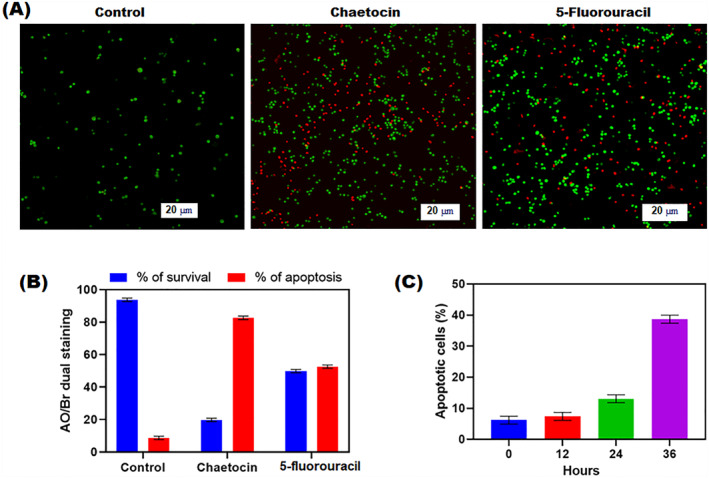
Apoptotic effect of chaetocin‐treated A549 cells by AO/EB dual staining. Percentage of live/dead cell populations assessed by Annexin V‐FITC/PI staining in flow cytometry. (a) Fluorescence microscopic images indicate the morphological changes of chaetocin‐treated A549 cells in 20 μm scale at 20x magnification. (b) Precentage of live and apoptotic cells after the treatment of chaetocin and 5‐fluorouracil. (c) The percentage of apoptotic cells after treatment of chaeticin at differnet time intervals (0, 12, 24, 36 h). Data are expressed as mean ± SD of triplicate assays. *p < 0.001 Control versus drug treated groups.