
Figure 5.
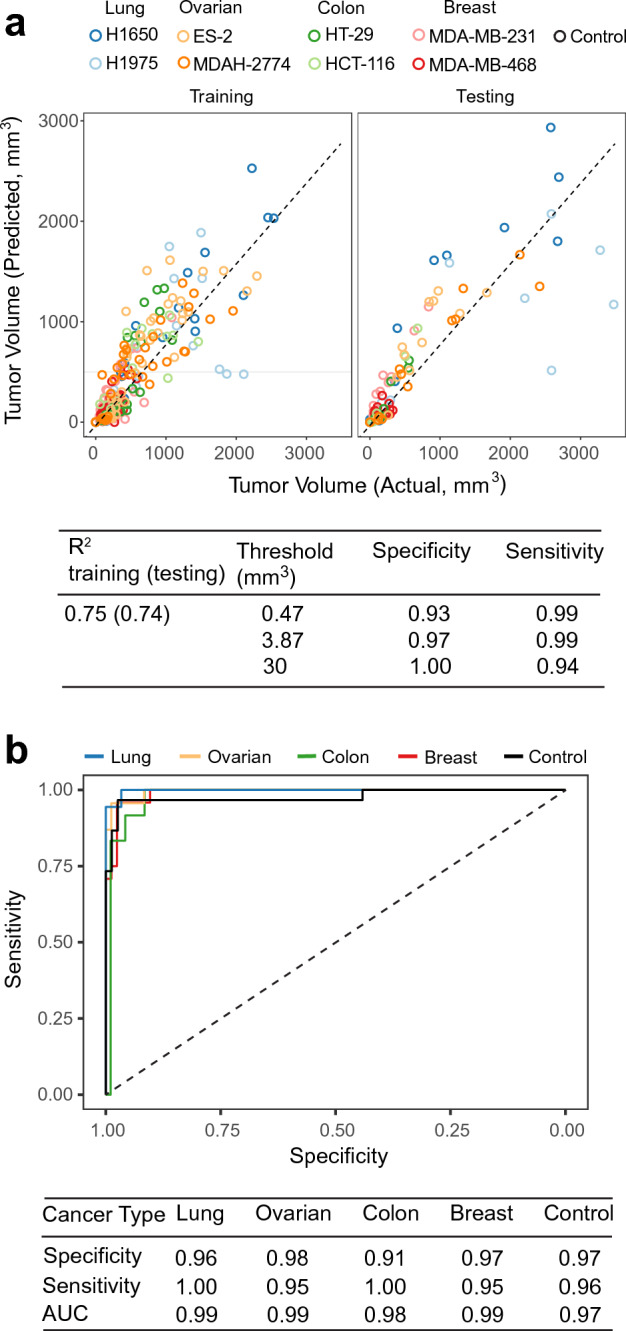
Tumor volume prediction and classification across cancer types. (a) Concordance of actual versus predicted tumor volume trained using 15 common analytes (Fig. 4b) obtained with linear regression with elastic net regularization. Result shown is the 27% hold-out test set. Dashed line indicates identity. (b) Receiver operating characteristic curves for tumor classification trained using 80 differentiating protein markers with elastic net regularization. Result shown is the 27% hold-out test set.