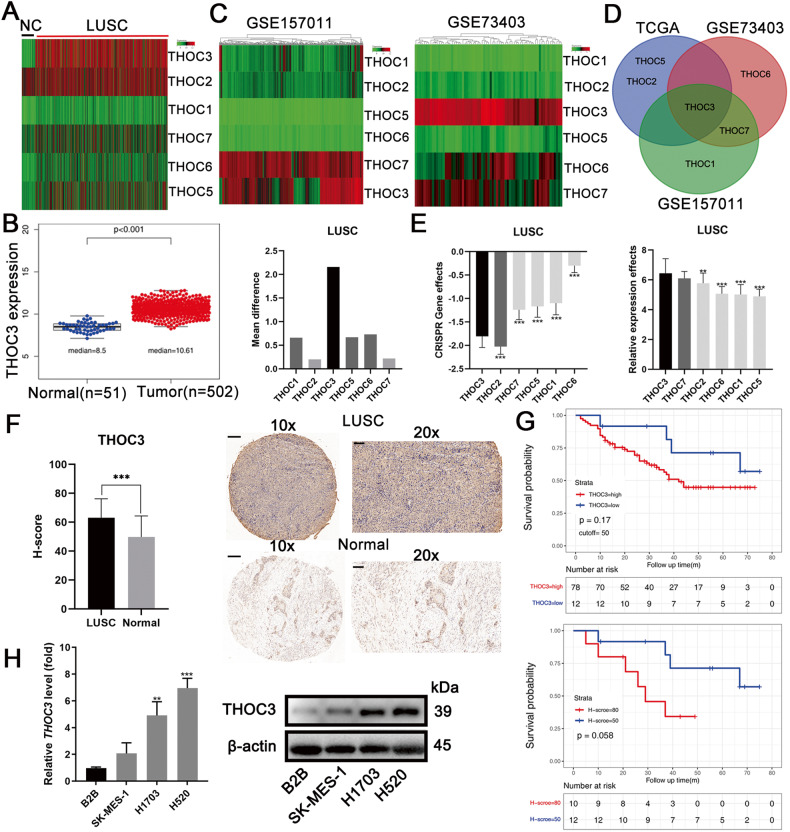
Fig. 1. THOC3 is highly expressed in LUSC.
A Heatmap of THOC gene expression levels in LUSC (n = 502) and normal tissues (n = 51) based on TCGA data. B Bar chart showing the difference in mean THOC expression levels between LUSC and normal tissues (right) and the specific expression levels of THOC3 in LUSC and normal tissues (left). C Heatmaps of THOC levels in LUSC datasets GSE157011 (n = 484) and GSE73403 (n = 69). D Venn diagram showing the three most highly expressed genes in the THOC family according to TCGA, GSE157011, and GSE73403. E DEPMAP analysis of the effects of THOC1/2/3/5/6/7 knockout on 22 LUSC cell lines (left) with THOC levels in 27 LUSC cell lines shown on the right. F Immunohistochemistry (IHC) staining of THOC3 in 90 pairs of LUSC tissues and adjacent normal tissues. Scale bars = 100 μm. G Kaplan-Meier plots of patients with high (H-score > 50) or low (H-score ≤ 50) THOC3 expression based on TMA results (top), and patients with H-score ≥ 80 or ≤50 based on TMA results (bottom). H THOC3 mRNA and protein expression levels in B2B, SK-MES-1, H1703, and H520 shown by qRT-PCR and WB. *P < 0.05; **P < 0.01; ***P < 0.001. Variables are presented as mean ± SD.

