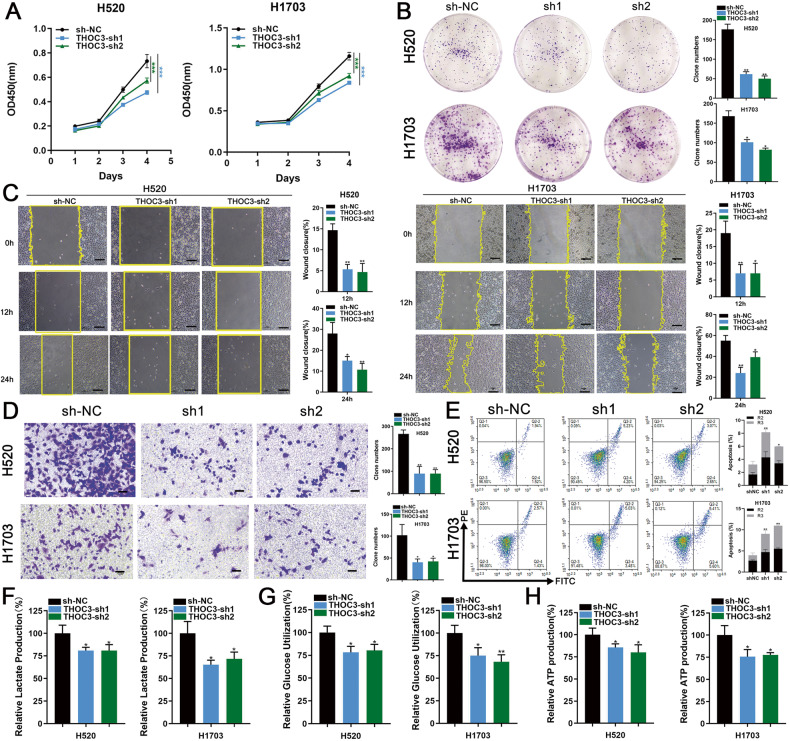
Fig. 2. THOC3 promotes the proliferation, migration, and glycolysis of LUSC.
A, B Growth curves (days 1–4) and colony formation assays represent the proliferation of H520/H1703 cells infected with shNC or THOC3-sh1/2. Representative images of the crystal violet staining of cells in a six-well plate are shown. C Migration of H520/H1703 cells infected with shNC or THOC3-sh1/2 was assessed using wound healing assays. Scratches were observed at 12 h and 24 h (10× magnification). D Transwell assays were performed to assess the migration of H520/H1703 cells with THOC3 knockdown. Cells crossing the membrane were dyed with crystal violet (10× magnification). Scale bars = 100 μm. E THOC3 knockdown resulted in increased apoptosis in LUSC cells. Representative FACS images and statistics based on three independent experiments are shown. F–H The impact of THOC3 knockdown on glucose uptake, lactic acid and ATP production in H520/H1703 cells after 24 h was evaluated. *P < 0.05; **P < 0.01; ***P < 0.001. Variables are presented as mean ± SD.

