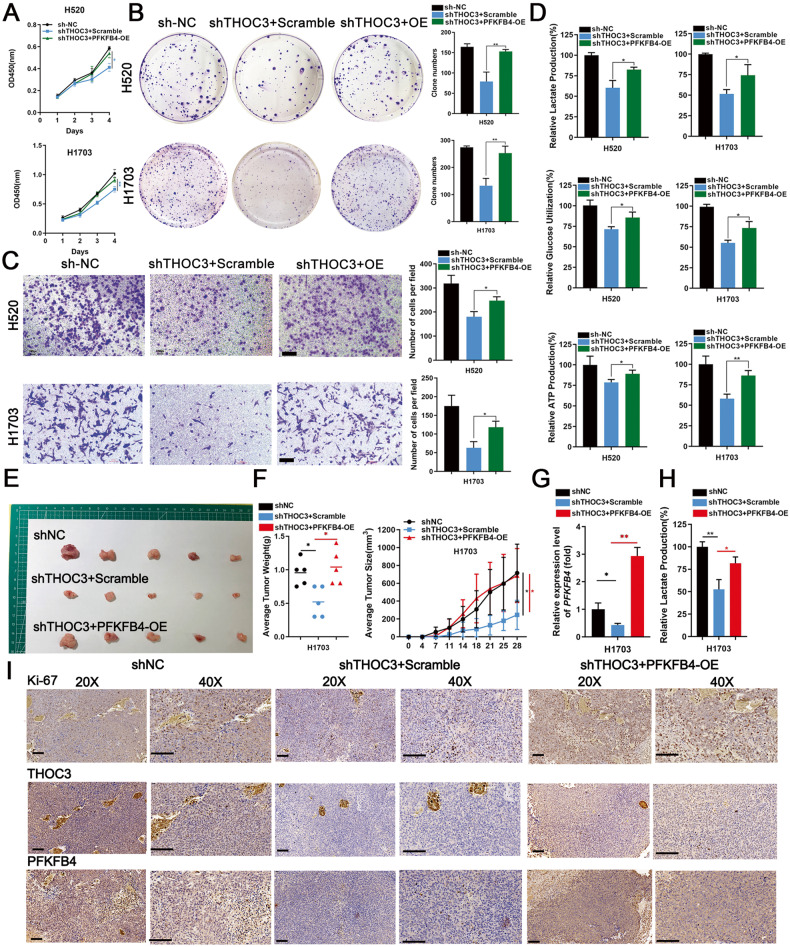
Fig. 6. Oncogenic role of THOC3 depends on PFKFB4.
A, B Growth curves (day 1–4) and colony formation assays depict the proliferation of H520/H1703 cells treated with shNC or shTHOC3 plus scramble/PFKFB4-OE plasmids. C Transwell assays show migration of shNC/shTHOC3 infected H520/H1703 cells with scramble/PFKFB4-OE (10× magnification). Scale bars = 100 μm. D The glucose uptake, lactic acid and ATP production of shNC/shTHOC3 infected H520/H1703 cells with scramble/PFKFB4-OE after 24 h. E–F Representative images of subcutaneous tumors on the left flank of mice injected with 1 × 10⁶ shNC/shTHOC3 infected H1703 cells with scramble or PFKFB4-OE plasmids (n = 5, each group). The mean weight of each tumor is measured, and tumor growth curves are plotted every 2–3 days. G PFKFB4 mRNA in shNC/shTHOC3 infected H1703 cells with scramble or PFKFB4-OE plasmids was shown by qRT-PCR. H Lactic acid production of the shTHOC3 groups transfected with scramble or PFKFB4-OE plasmids compared to the shNC group. I IHC shows the levels of Ki-67 index, THOC3, and PFKFB4 in three groups (20× and 40× magnification). Scale bars = 100 μm. *P < 0.05; **P < 0.01; ***P < 0.001. Variables are presented as mean ± SD.

