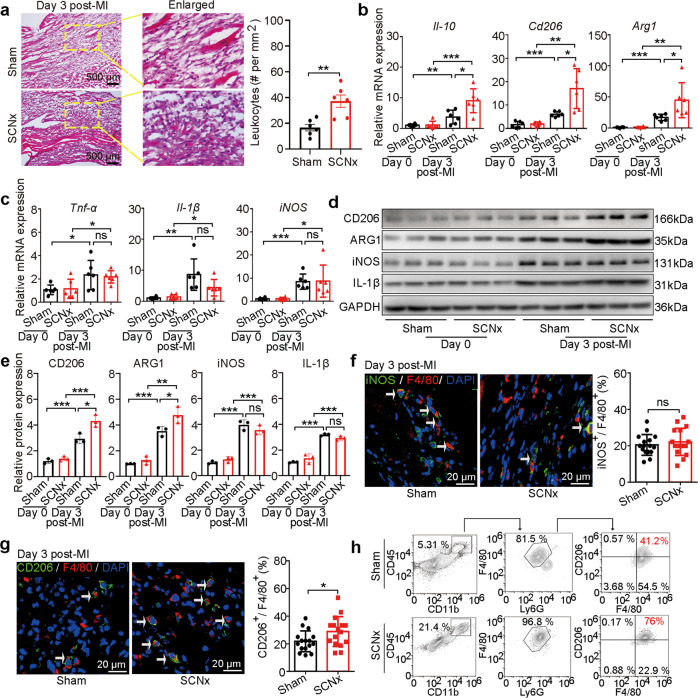
Fig. 4. SCN ablation modulated anti-inflammatory macrophage switch in the mouse heart post-MI.
a H&E staining and quantitative analysis of leukocytes (dark blue-purple monocytes) in the infarcted zone in the Sham-operated and SCNx mice on day 3 post-MI (Scale bars: 500 μm). b Gene expression levels of anti-inflammatory markers Il-10, Cd206, and Arg1 in the LV of Sham-operated and SCNx mice on days 0 and 3 post-MI (n = 6 per group). c Gene expression levels of pro-inflammatory markers Tnf-α, Il-1β, and iNOS in the LV of Sham-operated and SCNx mice on days 0 and 3 post-MI (n = 6 per group). d Western blot analysis of CD206, ARG1, IL-1β, and iNOS protein levels in infarcted hearts on day days 0 and 3 post-MI (n = 3 per group). e Relative densitometric quantification of CD206, ARG1, IL-1β, and iNOS protein levels in infarcted hearts on day 3 post-MI (n = 3 per group). f Representative immunofluorescence staining images and quantitative analysis showing iNOS+ and F4/80+ macrophages in the infarcted hearts of Sham-operated and SCNx mice on day 3 post-MI (Scale bars: 20 μm, n = 16 per group). g Representative immunofluorescence staining images and quantitative analysis showing CD206+ and F4/80+ macrophages in the infarcted heart of Sham-operated and SCNx mice on day 3 post-MI (Scale bars: 20 μm, n = 16 per group). h Flow cytometric analyses of the CD45+ CD11b+ Ly-6G- F4/80+ CD206+ macrophages in the infarcted hearts of Sham-operated and SCNx mice (n = 4 per group). Data are presented as mean ± SEM; Student’s t-test or one-way ANOVA; *P < 0.05, **P < 0.01, ***P < 0.001, ns not significant.

