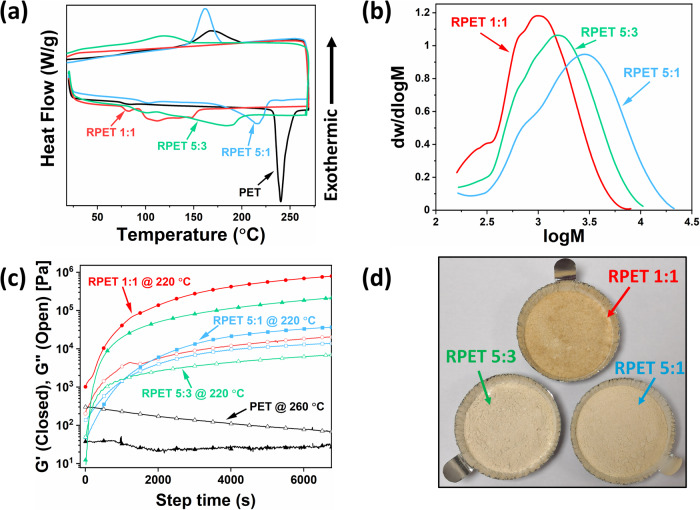
Fig. 2. Oligomeric RPET Characterization and Analysis.
Characterization of RPET feedstocks obtained from controlled depolymerization of PET with glycerol of varying amounts. a Differential scanning calorimetry temperature sweep of RPET compared to neat PET under a heating and cooling rate of 10 °C/min. Exothermic upwards. b Molecular weight distribution of RPET samples after gel permeation chromatography. The system was calibrated relative to polystyrene from 162 Da to 45.12 kDa. c Rheology results obtained for an isothermal oscillation at 1 Hz and 1% strain for 2 h. For all RPET samples, G’ (closed symbols) and G” (open symbols) changes were observed at 220 °C while for neat PET, G’ and G” changes were observed at its melting point of 260 °C. d Obtained grinded RPET 5:1, 5:3, and 1:1 powder feedstock.

