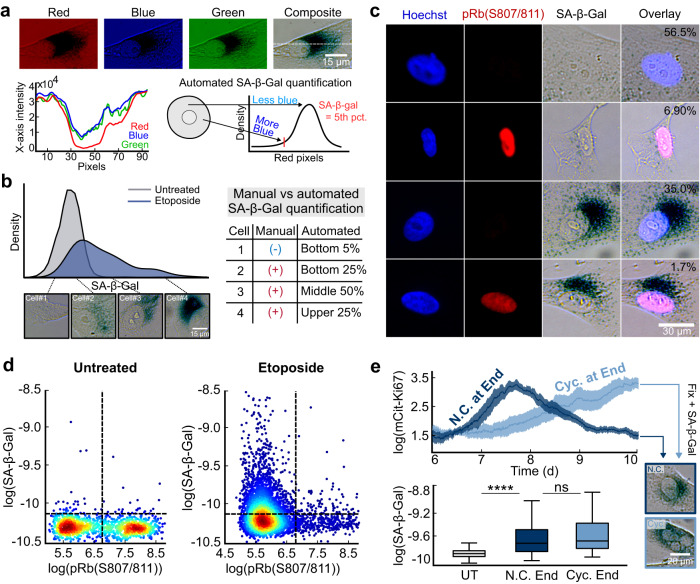
Fig. 2. Quantifying SA-β-Gal in single cells reveals a graded signal with overlap between treated and untreated cells and the presence of SA-β-Galpos cycling cells.
a A representative single MCF10A cell stained for SA-β-Gal and imaged in pseudo-color-brightfield at 6 d after release from a 24 h treatment with 10 μM etoposide. An intensity profile (dotted line) was taken from each channel of the RGB stack. We define the SA-β-Gal signal as the 5th percentile of the red pixels in the cytoplasm of each cell. b Distribution of SA-β-Gal signal in untreated cells or in cells released for 6 days after release from a 24 h treatment with 10 μM etoposide, with four representative single cells at increasing intensities of staining. c Heterogeneity in co-staining of SA-β-Gal and Rb phosphorylation by immunofluorescence in MCF10A cells released for 6 d from a 24 h treatment with 10 μM etoposide. Percentages reflect the fraction of cells with each behavior using the cutoffs in d. d Scatter plots of SA-β-Gal versus phospho-Rb from the same cells in c. Heatmap represents the density of data points. e The same data from Fig. 1d for etoposide-released cells that entered the cell cycle during live-cell imaging. Cells were split into those that completed a cell cycle during the 4 days of imaging but were Ki67off again by the final frame of the movie (N.C. at End) vs. those that were in the cell cycle and Ki67high on the final frame of the movie (Cyc. at End). Cells were fixed and stained for SA-β-Gal after the last frame of the movie was taken and each cell’s SA-β-Gal signal was linked to its Ki67 history.

