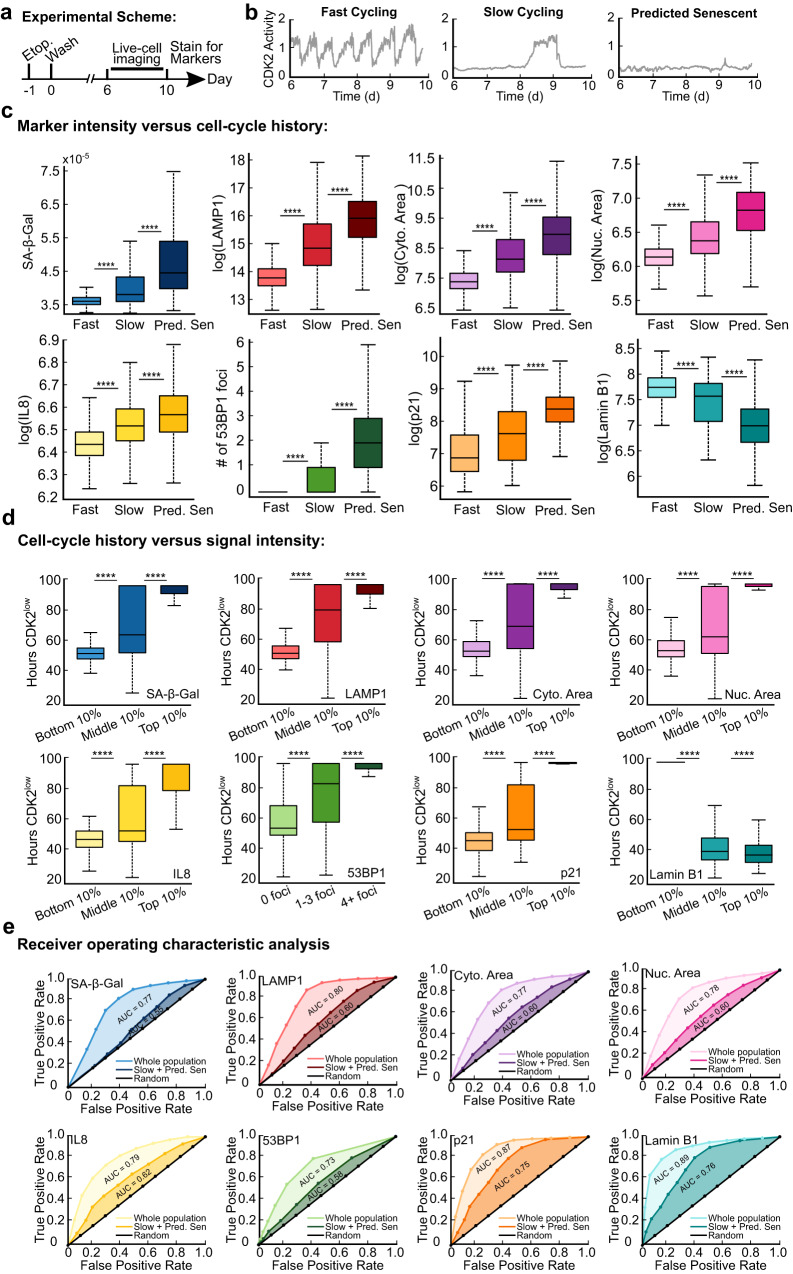
Fig. 4. Senescence biomarker intensities reflect cell-cycle histories and can resolve predicted-senescent cells with varying levels of accuracy.
a-e MCF10A cells expressing the CDK2 activity sensor were treated with 10 μM etoposide for 24 h, washed, and subjected to time-lapse microscopy from 6-10 d after release. The cells were fixed and stained for SA-β-Gal, LAMP1, succinimidyl ester, Hoechst, IL8, 53BP1, p21, and Lamin B1 after the last frame was taken. b, c Cells were split into fast cycling, slow cycling, or predicted senescent based on their duration spent CDK2low during live cell imaging, and the intensity of each marker was plotted for each cellular behavior. d The duration cells spent in the CDK2low state was plotted against the bottom, middle, and top 10% of signal for each marker. e ROC analysis using markers to identify predicted-senescent cells amidst all cells (fast-cycling, slow-cycling, and predicted-senescent cells), or amidst only slow-cycling and predicted-senescent cells. AUC indicates the area under the curve for each condition.

