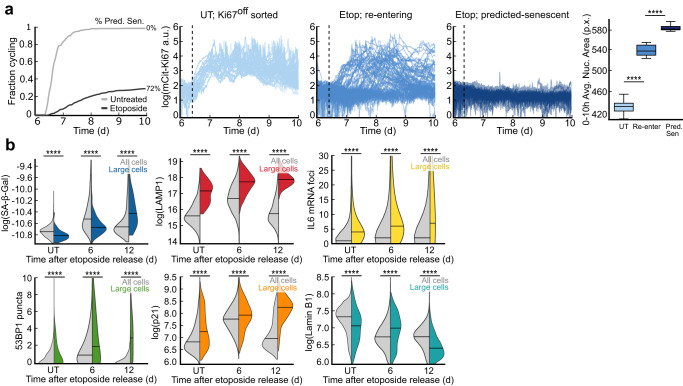
Fig. 7. The largest cells in the population go on to accumulate features of senescent cells.
a The data as in Fig. 1d. Cumulative distribution function (CDF) curves represent the fraction of cells that re-enter the cell cycle during the movie; the remainder of cells are defined as predicted-senescent (72%). Cells were clustered based on their relative mCitrine-Ki67 signals after sorting: untreated, re-entering, and predicted-senescent. The mean nuclear area within the first 10 h of filming was plotted for each category. UT, untreated. b SA-β-Gal, LAMP1, IL6 mRNA, 53BP1, p21, and Lamin B1 signal were measured at 6 d and 12 d after release from a 24 h treatment with 10 μM etoposide. Data are plotted for all cells (gray) vs. large cells (colors), which are defined as those with cytoplasmic areas >95th percentile of UT cells.

