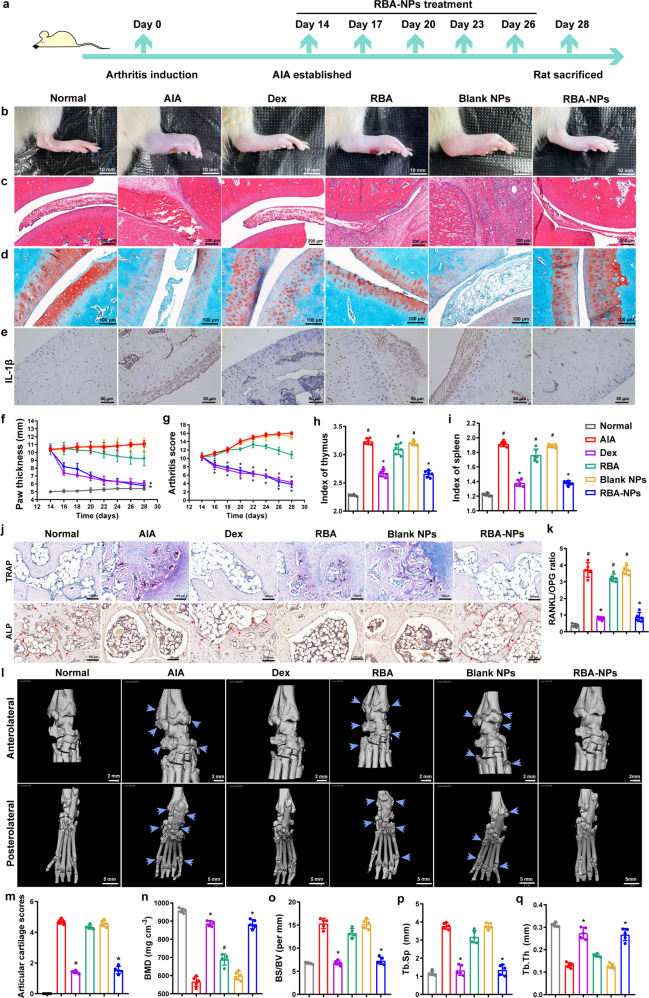
Fig. 4.
RBA-NPs inhibit inflammation and promote bone erosion repair in AIA rats. a The schematic illustration of RBA-NPs treatment. b Representative photographs of hindlimbs at the endpoint of the experiment from different treatment groups. Scale bar = 10 mm. c Histopathology evaluation of ankle joints was identified using H&E. Scale bar = 100 μm. d Detection of cartilage injury of rats ankle joint in each group by Safranin O-Fast green staining (n = 5 independent animals). Scale bar = 100 μm. e Immunohistochemical analyses of of IL-1β expression levels in arthritic joints in different groups (n = 5 independent animals). Scale bar = 80 μm. IL-6 and TNF-α expression levels in arthritic joints were showed in Supplementary Fig. 8. f, g Paw thickness and arthritis score of AIA rats were recorded every other day during the treatment period. Data represent mean ± SD (n = 7 independent animals). *P < 0.05 vs. N.S. group. h, i Index of spleen and thymus of AIA rats were recorded every other day during the treatment period. Data represent mean ± SD (n = 7 independent animals). #P < 0.05 vs. Normal group; *P < 0.05 vs. N.S. group. j Detection of TRAP-stained osteoclast and ALP-stained osteoblast expression levels in arthritic joints in different groups (n = 5 independent animals). Scale bar = 100 μm. Osteoclasts located in the marrow cavity were stained red. TRAP-positive multinuclear cells that contained more than three nuclei were denoted as osteoclasts. k RANKL/OPG ratio in arthritic joints from rats receiving the indicated treatment. Data represent mean ± SD (n = 5 independent animals). l Representative micro-CT images of the anterolateral and the posterolateral ankle joints at the endpoint of the experiment from different treatment groups in therapeutic efficacy study (n = 6). Scale bar = 2 mm. m–q Quantitative micro-CT analysis of articular cartilage scores, BMD, BS/BV, Tb.Sp and Tb.Th of the ankle joints at the endpoint of the experiment. Data represent mean ± SD (n = 3 independent animals)

