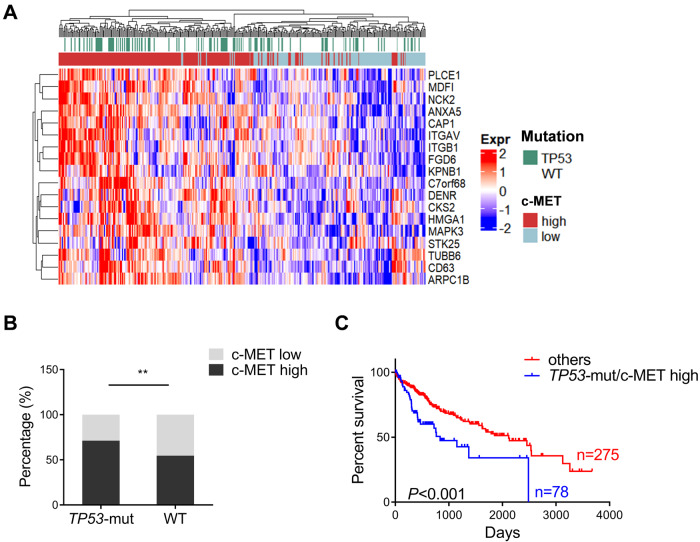
Fig. 1. A subset of human HCC samples with c-MET activation and TP53 mutations based on the TCGA dataset.
A Heatmap of the human HCC samples depicting TP53 mutations and c-MET activation. B c-MET signature is enriched in TP53 mutant human HCC samples. C Survival curves of patients harboring concomitant TP53 mutation and c-MET activation, indicating a poor prognosis compared to other patients (includes TP53 mutant/c-MET low, TP53 WT/c-MET low, and TP53 WT/c-MET high HCCs). Data are shown as mean ± SD. B Student’s t-test: **P < 0.01; C Log-rank (Mantel–Cox) test. WT wild-type.

