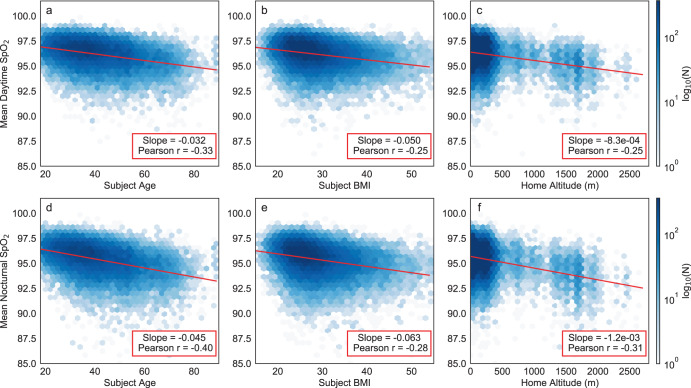
Fig. 4. Linear relationships between measured mean oxygen saturation values and each of three independent variables exhibiting the strongest correlation with these metrics.
a–c (top row) correspond to mean daytime SpO2. d–f (bottom row) correspond to mean nocturnal SpO2. Independent variables consist of: a, d age, b, e body mass index, c, f home altitude. Each plot presents a 2-dimensional histogram of values from all 33,080 subjects in evenly spaced hexagonal bins, with the color density corresponding to log-scaled bin counts for visual clarity. In each plot, the overlaid red line represents the simple univariate linear regression fit using the independent variable shown on the x-axis. The listed slope and Pearson correlation coefficient correspond to the same univariate linear fit.

