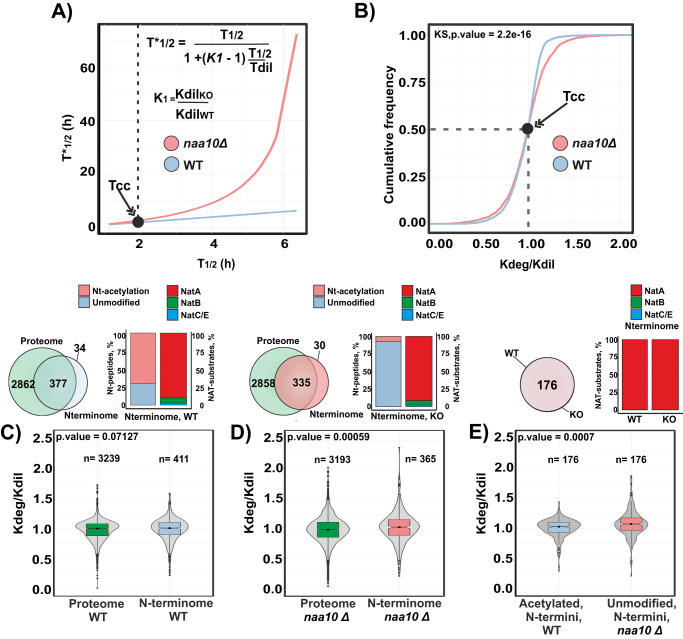
Fig. 3. Lack of N-terminal acetylation due to deletion of NAA10 promotes protein degradation of NatA substrates in the yeast proteome.
A A comparison between determined half-lives in WT system (T1/2) and modeled effect of WT half-lives (T*1/2) with a reduced dilution constant (KdilKO = −0.26). Red line represents the predicted half-lives due to the lack of naa10 and blue line the determined half-lives in WT. Cell cycle time (Tcc = 1.9 h) of the WT system is marked by an arrow (Black dot). Data were modeled using the equation show on top and calculated according to ref. 46. B Cumulative frequency plot of the normalized turnover rate (Kdeg/Kdil) determined in naa10Δ and WT system (WT, blue; naa10Δ, red). Two-sided Kolgomorov-Smirnov test, KS P = −2.2 e-16. C, D Violin plot of normalized turnover rates of WT and naa10Δ proteome compared to their corresponding N-terminome. Statistical significance was assessed using two-sided Wilcoxon test, multiple test correction according to Benjamini–Hochberg, ns = P > 0.05, *P < = 0.05, **P < = 0.01, ***P < = 0.001, ****P < = 0.0001; box bounds correspond to quartiles of the distribution (center: median; limits: 1st and 3rd quartile; whiskers: +/− 1.5 IQR). Overlap between the N-terminome and proteome detected in the pSILAC, as well as the N-terminome acetylation status and NAT substrate class are shown on top. (n = protein or peptide normalized turnover rates derived from at least two independent experiments per condition). E Same as (C, D), but comparing the N-terminal acetylated peptides of the NatA type detected in the WT and their corresponding unmodified N-terminal peptides detected in naa10Δ cells. Source data are provided as a Source Data file (A–E).

