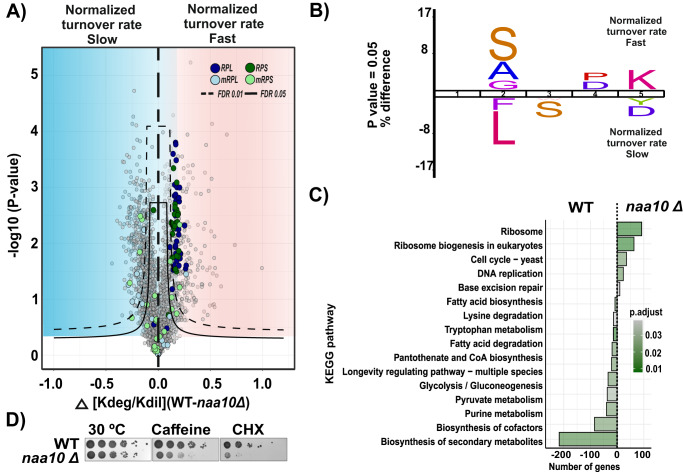
Fig. 4. Lack of NatA activity promotes the enhanced degradation of cytosolic ribosomal proteins.
A Comparison of the naa10Δ and WT systems as a volcano plot to identify significant changes in protein turnover rates. Significant regulated proteins at 1% and 5% false discovery rate (FDR) are delimited by dashed and solid lines, respectively (FDR controlled, two-sided t test, randomizations = 250, s0 = 0.1). Significant proteins were classified into two groups; Fast, red and slow, blue. B Ice logo diagram comparing the first five sequence amino acids of the significant fast and slow normalized turnover rate proteins (P < 0.05 unpaired two-tailed Student’s t test). C GSEA-based KEGG pathway enriched analysis. P values were calculated by a two-sided permutation test and multiple hypothesis testing was FDR corrected. The significance threshold set at FDR > 0.05. D Phenotypic growth of S. cerevisiae naa10Δ in the presence of various stressors. The indicated yeast strains were grown to early log phase and serial 1/10 dilutions containing the same number of cells were spotted on various media and imaged the 6 following days. 30 °C, incubated for 3 days on YPD at 30 °C; Caffeine, incubated for 3 days on YPD + 0.2% caffeine; and CHX, incubated for 3 days on YPD + 0.2 μg/ml cycloheximide. Source data are provided as a Source Data file (A).

