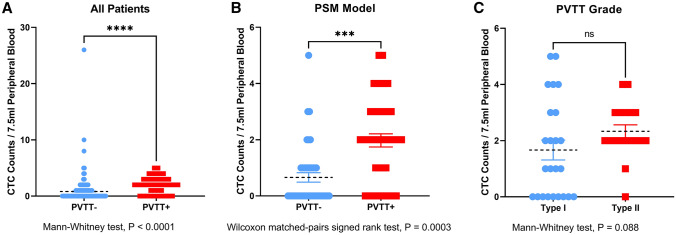
Fig. 2.
Comparison of preoperative CTC counts in different PVTT groups. A HCC patients without PVTT versus HCC patients with PVTT in the full cohort, Mann–Whitney test, P < 0.0001; B HCC patients without PVTT versus HCC patients with PVTT in the PSM model, Wilcoxon matched-pairs signed rank test, P = 0.0003; C Type I PVTT versus Type II PVTT (Cheng’s classification), Mann–Whitney test, P = 0.088. Asterisk for significant, ns for not significant

