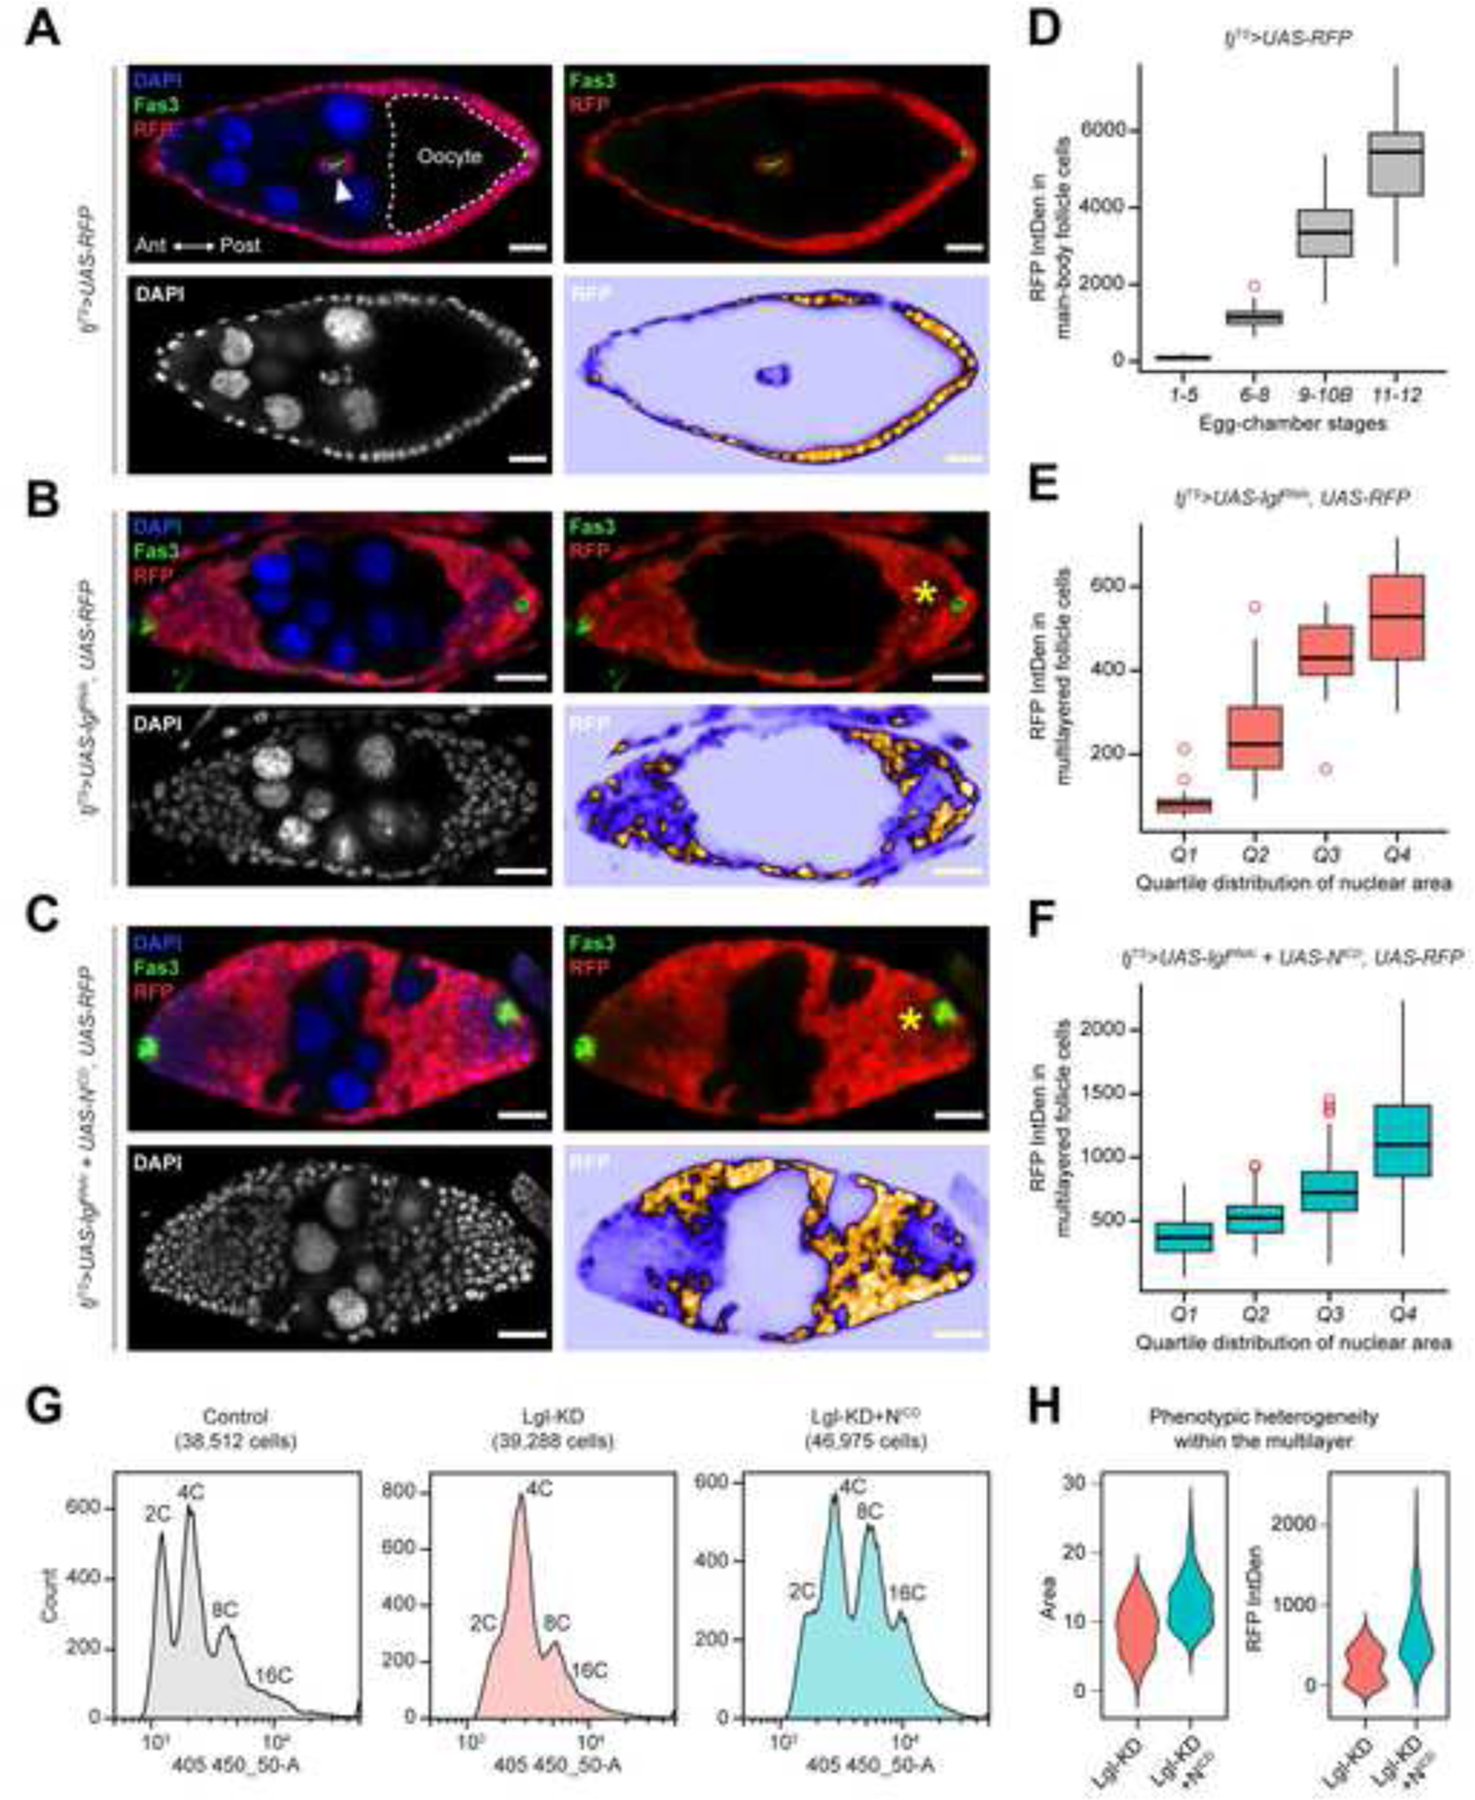
Figure 1. Multilayering of Lgl-KD expressing follicular epithelia exhibits intracellular heterogeneity.

(A) Monolayered egg chambers containing RFP+ follicle cells (red) during midoogenesis follicle cells that form an epithelial monolayer around germline cells with larger nuclei (nurse cells) and the oocyte (dashed border). A pair of Fas3+ (green) polar cells appear within border cells (arrowhead) that delaminate from the anterior (Ant) epithelia, while another pair remains fixed in the posterior (Post) epithelia. DAPI is colored in blue. The top-right panel shows the relative position of Fas3+ polar cells and RFP+ follicle cells. Bottom panels specifically show DAPI (Left) and RFP intensities (Right). Comparable stages of egg chambers containing (B) Lgl-KD and (C) Lgl-KD+NICD in follicle cells are also shown. Follicle cells expressing uneven fluorescence intensities are indicated by asterisks (*). Scale bars: 20μm. (D) Box-and-whisker plot show the distribution of RFP intensity per cell (Y-axis) in tjTS>RFP control follicle cells at different stages of oogenesis (X-axis). Similar box-and-whisker plots show the distribution of RFP intensities in (E) Lgl-KD and (F) Lgl-KD+NICD cells within the multilayers (Y-axis) over increasing nuclear area that is binned into quartile distributions (X-axis). (G) Histograms show ploidy distribution of tjTS-RFP control, Lgl-KD and Lgl-KD+NICD follicle cells in respective samples. (H) Violin plots show the distributions of nuclear area (Left) and RFP intensities (Right) of each cell within the multilayered Lgl-KD and Lgl-KD+NICD follicle cells. See also Figure S1–S2.
