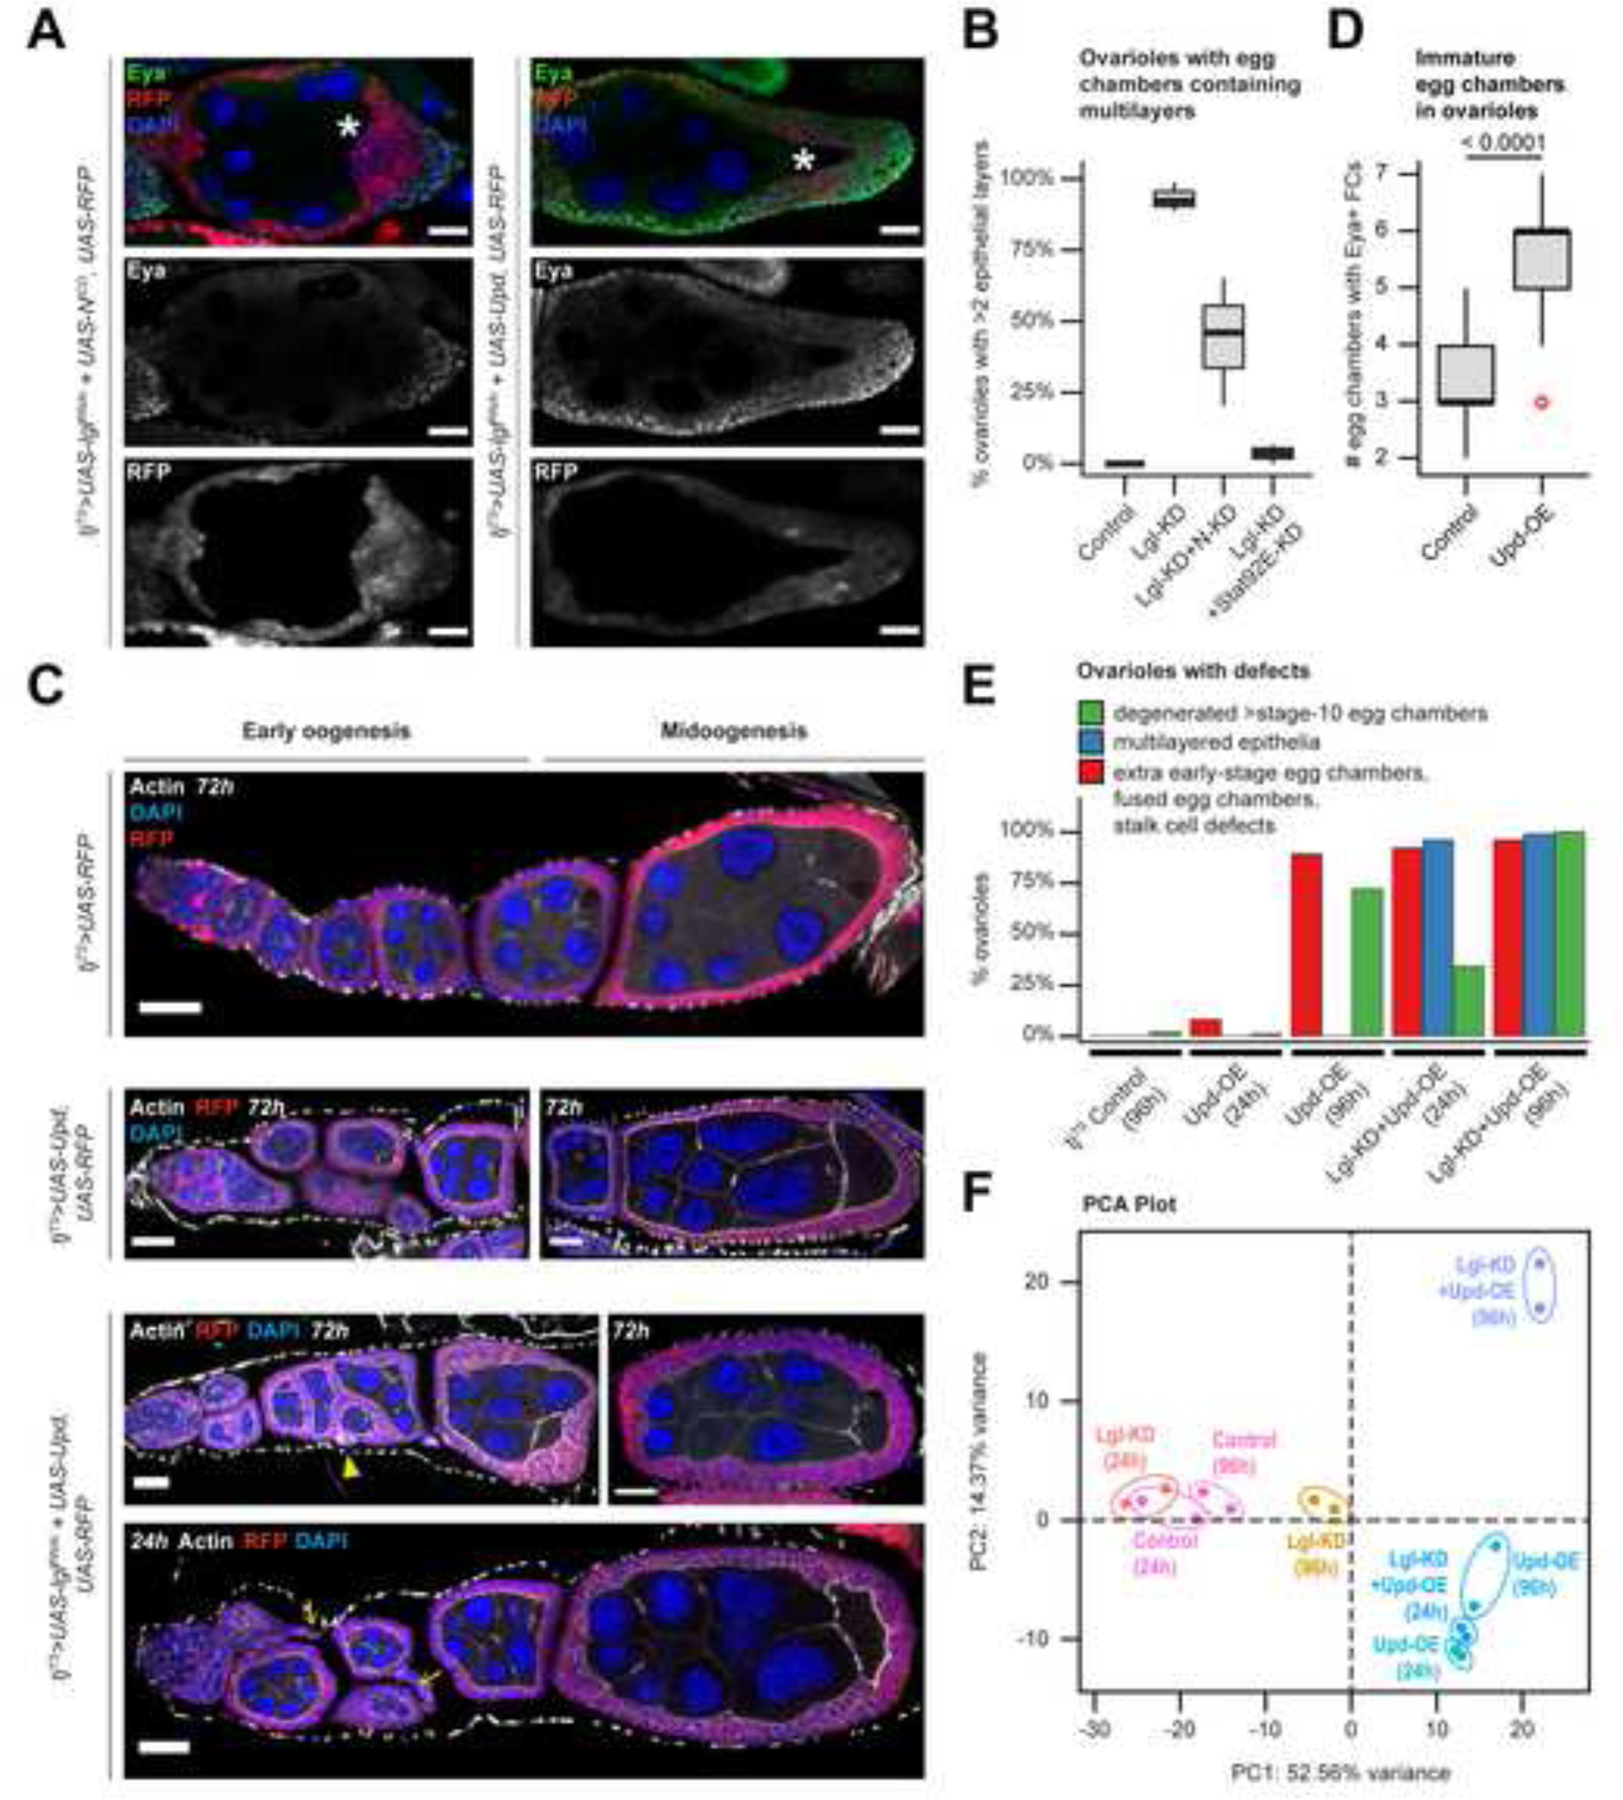
Figure 3. Unrestricted Upd-exposure induces defects in both normal and Lgl-KD follicle cells.

(A) Confocal images of stage-8 egg chambers containing RFP+ (red) follicle cells with Lgl-KD+NICD (Left) and Lgl-KD+Upd-OE (Right) expression. Eya expression is detected within immature cells (green). Oocyte are marked by asterisks (*). Intensities of RFP expression and Eya antibody enrichment are shown separately (grayscale) in the middle and bottom panels. (B) Box-and-whisker plot to show the distribution of ovarioles from different genotypes (X-axis) with complete or partial (<2 layers) rescue of multilayering over 3 independent experiments. (C) Confocal images of egg chambers containing follicle cells expressing tjTS-driven RFP control (1st row), Upd-OE for 72h (2nd row), and Lgl-KD+Upd-OE for 72h (3rd row) and 24h (4th row) during early and midoogenesis. Abnormal stalk cells are indicated by yellow arrows while fused egg chambers with encapsulation errors are indicated by yellow arrowheads. Nuclei is marked by DAPI (blue). F-Actin is marked by Phalloidin (white). Scale bars: 20μm. (D) Box-and-whisker plot to show the number of egg chambers containing immature (Eya+) follicle cells (Y-axis) in individual ovariole, for when follicle cells express Upd-OE (compared with control). The p-value obtained from unpaired t-test comparison of the two distributions is indicated above the plot. (E) Bar plot to show the occurrence (%) of stage-specific ovarian phenotypes when Upd-OE and Lgl-KD+Upd-OE are expressed in follicle cells for 24h and 96h (compared with ovarioles with tjTS control follicle cells at 96h). (F) PCA distribution of whole-tissue transcriptomes of ovaries containing follicle cells expressing tjTS-driven Lgl-KD, Upd-OE and Lgl-KD+Upd-OE for short (24h) and long (96h) time-points, along with the corresponding control samples. Individual samples are uniquely colored and replicates per sample are encircled. See also Figure S5.
