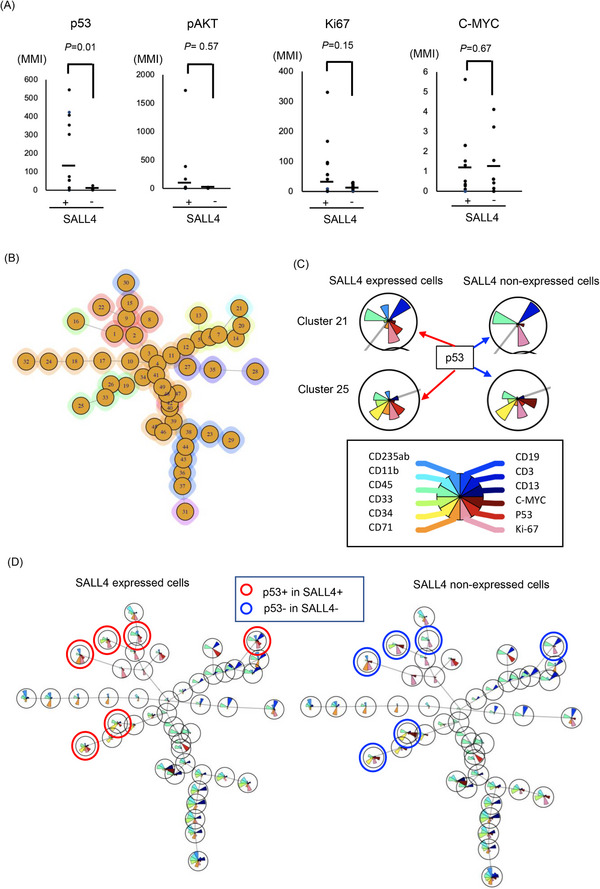
FIGURE 2.

ViSNE analysis on SALL4 expressing cells in MDS samples. (A) P53, ki67, c‐myc or pAKT expression of SALL4 expressing cells and SALL4 non‐expressing cells. (B) Cells were clustered into 49 groups on FlowSOM analysis. (C) The example of FlowSOM via viSNE analysis based on the distribution of SALL4, p53, Ki67 and major lineage markers (CD235ab, CD11b, CD45, CD33, CD34, CD71, CD19, CD3, CD11b) on SALL4 expressing cells (left side) and SALL4 non‐expressing cells (right side) on cluster 21 and 25. The brown fan shape indicates p53. (D) FlowSOM via viSNE analysis on SALL4 expressing cells (left panel) and SALL4 non‐expressing cells (right panel). The pie‐chart visualizes the relative expression. The red circle indicated both p53 and SALL4 expressed cells. The blue circle indicated only p53 expressed, and SALL4 non‐expressed cells.
