
FIGURE 3.
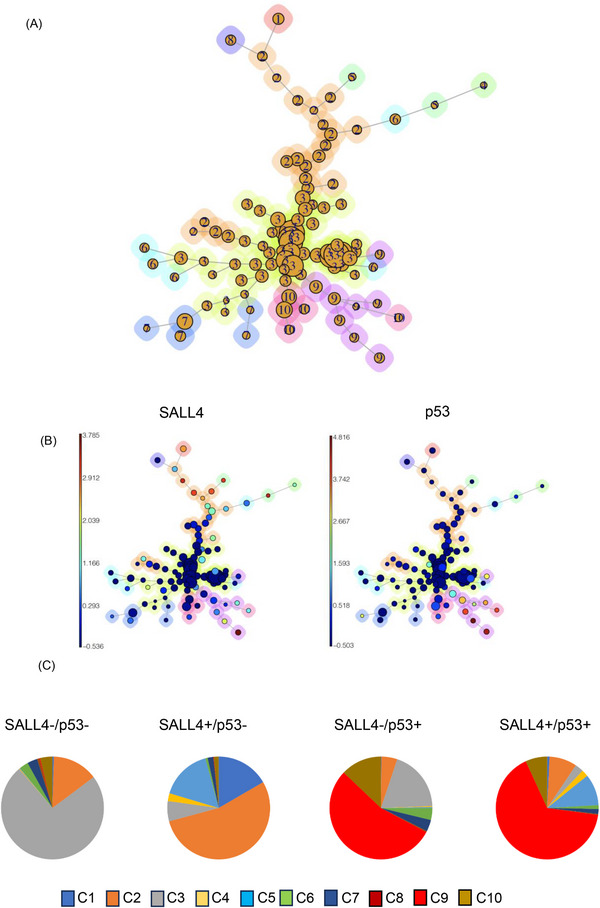
Examination of SALL4 and p53 expression in MDS bone marrow cells. (A) Cells were clustered into 12 nodes and depicted as a minimal spanning tree, to the ten identified clusters on FlowSOM analysis. (B) Aggregated events of SALL4 (left) and p53 (right) on FlowSOM analysis. (C) The pie chart showing percentage of SALL4‐p53‐ cells, SALL4+p53‐ cells, SALL4‐p53+ cells and SALL4+p53+ cells in each cluster.