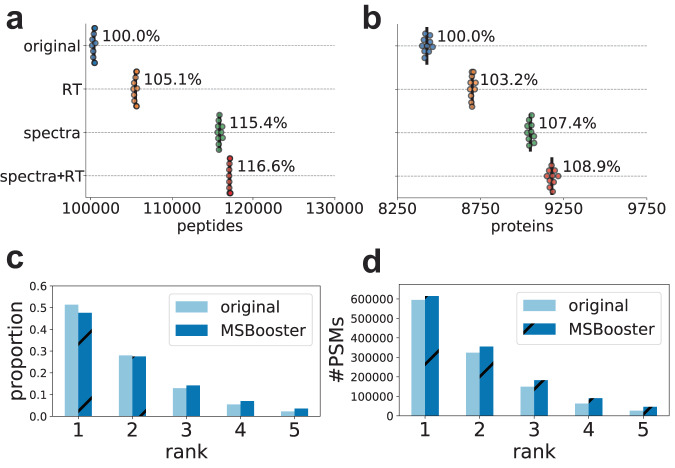
Fig. 4. Melanoma DIA rescoring with MSFragger-DIA.
a and b Swarmplots of the number of peptides (a) or proteins (b) reported at 1% FDR. c and d The proportion of PSMs (c) or total number of PSMs (d) from each of the five ranks reported. The darker, diagonally dashed bars represent results after spectral and RT rescoring, while the lighter, solid bars represent the results without using deep learning features. Source data are provided as a Source Data file.

