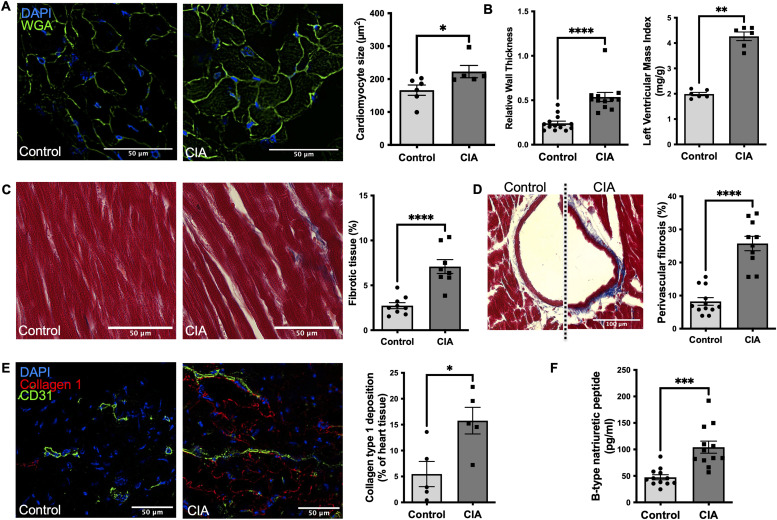
Figure 2. Left ventricular remodeling and fibrosis are present in mice with collagen-induced arthritis (CIA) with clinically relevant diastolic dysfunction mimicking heart failure in RA patients.
(A) Representative images of LV sections stained with WGA for cell membrane and DAPI staining of DNA to measure cardiomyocyte cell size defined by the cross-sectional area (Scale bar 50 μm) (n = 6). (B) Left ventricular mass, a parameter estimating total LV weight was calculated using Vevo LAB ultrasound analysis software as the difference between the epicardium-delimited volume and the LV chamber volume multiplied by an estimate of myocardial density. Diastolic LV posterior wall thickness (LVPWd) was measured at the end diastole as a measure of LV geometry and expansion (n = 12). (C) Representative LV section images of Masson’s trichrome staining for fibrotic tissue (blue) in a mouse with CIA and a healthy control, respectively. Comparative analysis of the total area of fibrotic tissue in LV sections (Scale bar 50 μm) (n = 9/8). (D) Representative images of Masson’s trichrome staining with perivascular fibrosis and quantitative analysis (scale bar: 100 μm). (For each mouse, five vessels chosen at random were quantified and their average was used for comparative analysis; n = 10). (E) Quantification of collagen type 1 (red) and vasculature (CD31+ cells) in LV. Representative images are shown (scale bar: 50 μm) (n = 5). (F) Plasma levels of brain natriuretic peptide, a hormone produced by the body when the heart is enlarged, as measured by ELISA on day 56 in mice with CIA and a healthy control group (n = 12). Data are mean ± SEM. (F) *P < 0.05, **P < 0.01, ***P < 0.001; Mann–Whitney U test (F) t test.

