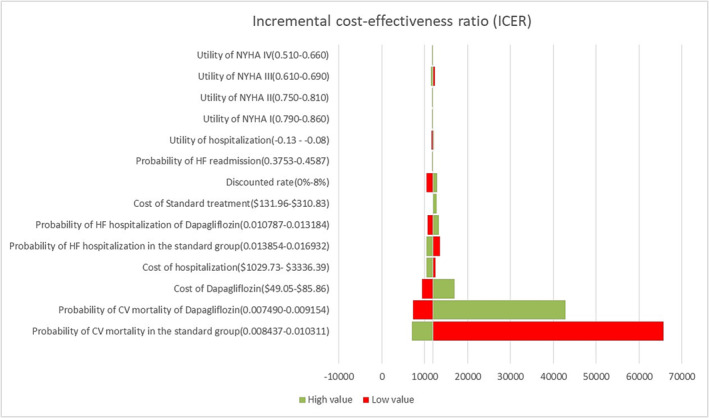
Figure 2.

Tornado diagram showing the resulting ICERs across the values of the parameters. Red corresponds to the lower limit while green corresponds to the upper limit of the parameter. CV, cardiovascular; HF, heart failure; NYHA, New York Heart Association.
