Figure 3.

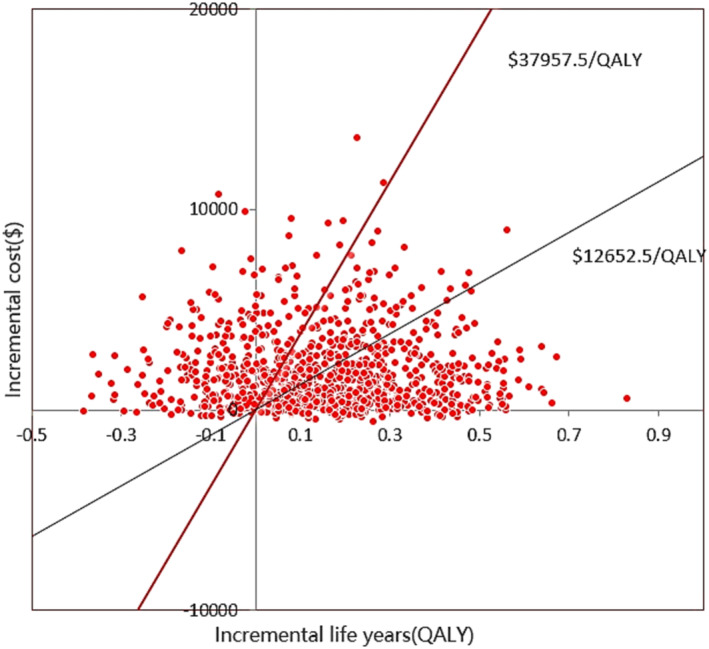
Scatter plot showing the incremental costs and the incremental quality‐adjusted life‐year for a thousand simulations. QALY, quality‐adjusted life‐year.

Scatter plot showing the incremental costs and the incremental quality‐adjusted life‐year for a thousand simulations. QALY, quality‐adjusted life‐year.