Figure 2.

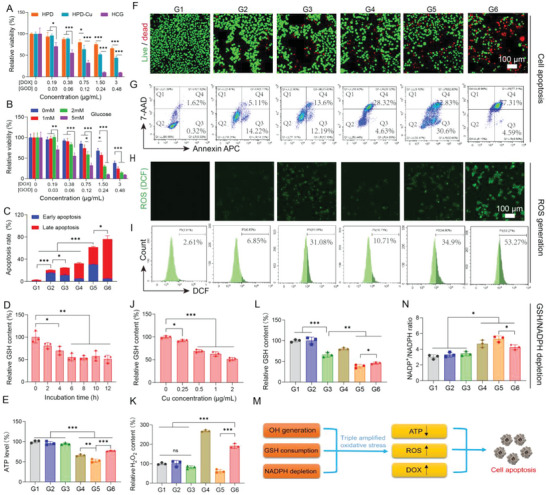
In vitro antitumor evaluation and mechanism study on 4T1 tumor cells in normoxic conditions. A) Cell viability assay of HPD, HPD‐Cu, and HCG on 4T1 cells. B) Cytotoxicity assessment of HCG under different glucose concentrations. C) Quantitation of cell apoptosis results measured by flow cytometry. D) The GSH levels of 4T1 cells treated with HCG for different times. E) ATP levels of 4T1 cells after various treatments. F) Live/dead staining (scale bars: 100 µm) and G) cell death mechanism of 4T1 cells after different treatments. ROS levels in 4T1 cells after different treatments identified by H) confocal imaging (scale bars: 100 µm) and I) flow cytometry. J) Relative GSH content in 4T1 cells after treatment with different concentrations of HCG. Relative K) H2O2, L) GSH, and N) NADP+/NADPH ratio contents in 4T1 cancer cells with various treatments. M) Summary of HCG‐induced cell apoptosis. Statistical significance was calculated by t‐test. p values: * p < 0.05, ** p < 0.01, *** p < 0.001, ns stands for not significant.
