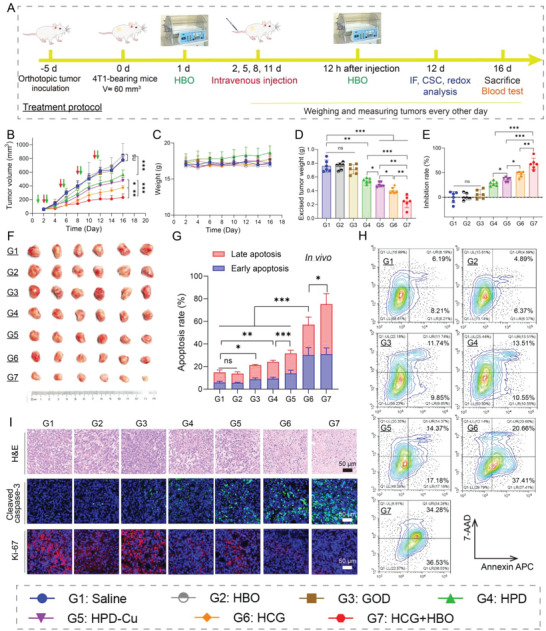
Figure 5.

Pharmacodynamic evaluation in vivo. A) Schematic illustration of orthotopic 4T1 tumor model establishment and treatment protocol. B) Tumor volumes and C) body weights of the mice in various treatment groups. D) Average tumor weight at the end of different treatments. E) TIRs of different groups. F) Photographic images of tumors excised from different groups after various treatments. G,H) Assessment of apoptosis in tumor tissues after different treatments. I) H&E, Cleaved caspase‐3, and Ki‐67 staining images of tumor after different treatments. Scale bars: 50 µm. Statistical significance was calculated by t‐test. p values: * p < 0.05, ** p < 0.01, *** p < 0.001, ns stands for not significant.
