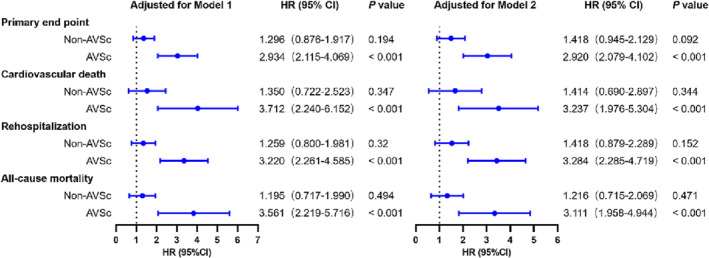
Figure 4.

Forest plot of t‐PA as a predictor for endpoints in CAD patients with or without AVSc. T‐PA level was analysed as a log‐transformed continuous variable. Model 1: adjusted for age and sex, Model 2: adjusted for age and sex, and then for the whole model, including age, sex, risk factors for coronary artery disease, alcohol consumption, HbA1c, lipid profiles, r‐GT, eGFR, and drug usage.
