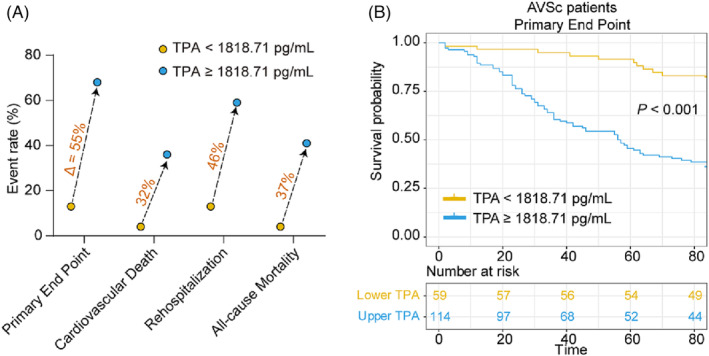
Figure 5.

Event rates and Kaplan–Meier curve analysis according to estimated t‐PA cut‐off value in patients with AVSc. (A) Rates of the primary endpoint, cardiovascular death, rehospitalization, and all‐cause mortality for patients below and above t‐PA cut‐off value (1818.71 pg/mL) in AUC‐ROC analysis. (B) Kaplan–Meier curves for primary endpoint for all patients according to the cut‐off value of t‐PA level.
