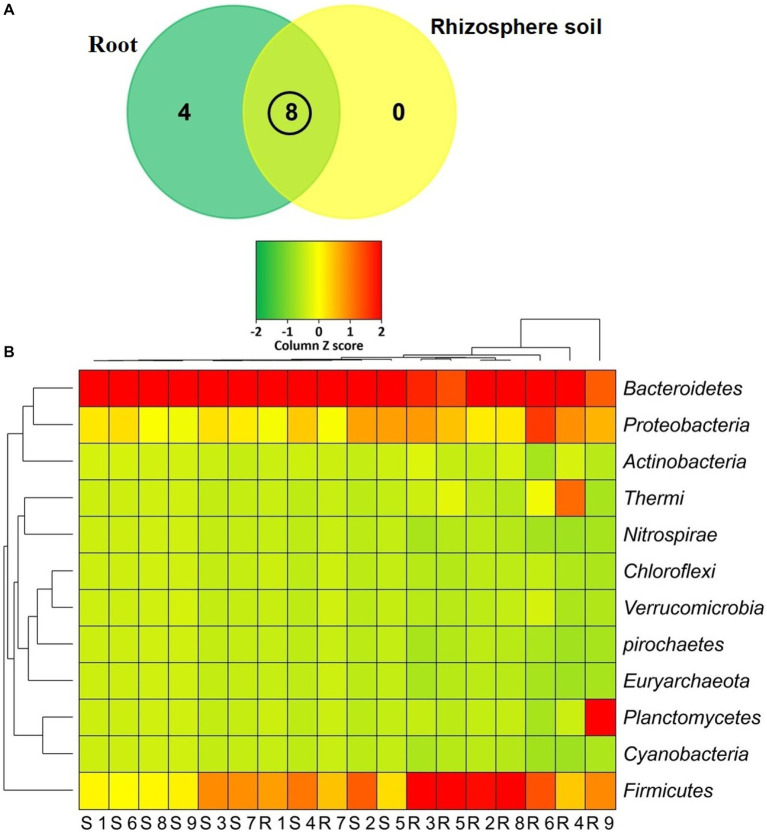
Figure 6.
Taxonomic composition of the microbiome at phylum level. (A) Venn diagram representing the unique and shared bacterial phyla detected in rhizosphere soil (S1-S9) and root (R1-R9) samples. A total of 12 phyla were detected in both metagenomes where 8 phyla were found to be shared. (B) Heat map showing the composition and relative abundance of the detected phyla. The less abundant phyla in a given sample are shown in green, those that had medium abundant are in yellow, and phyla that are more abundant are represented in red. The varying color codes (Z-score) indicate the presence and completeness of each phylum, expressed as a value between −2 (low abundance) and 2 (high abundance).

