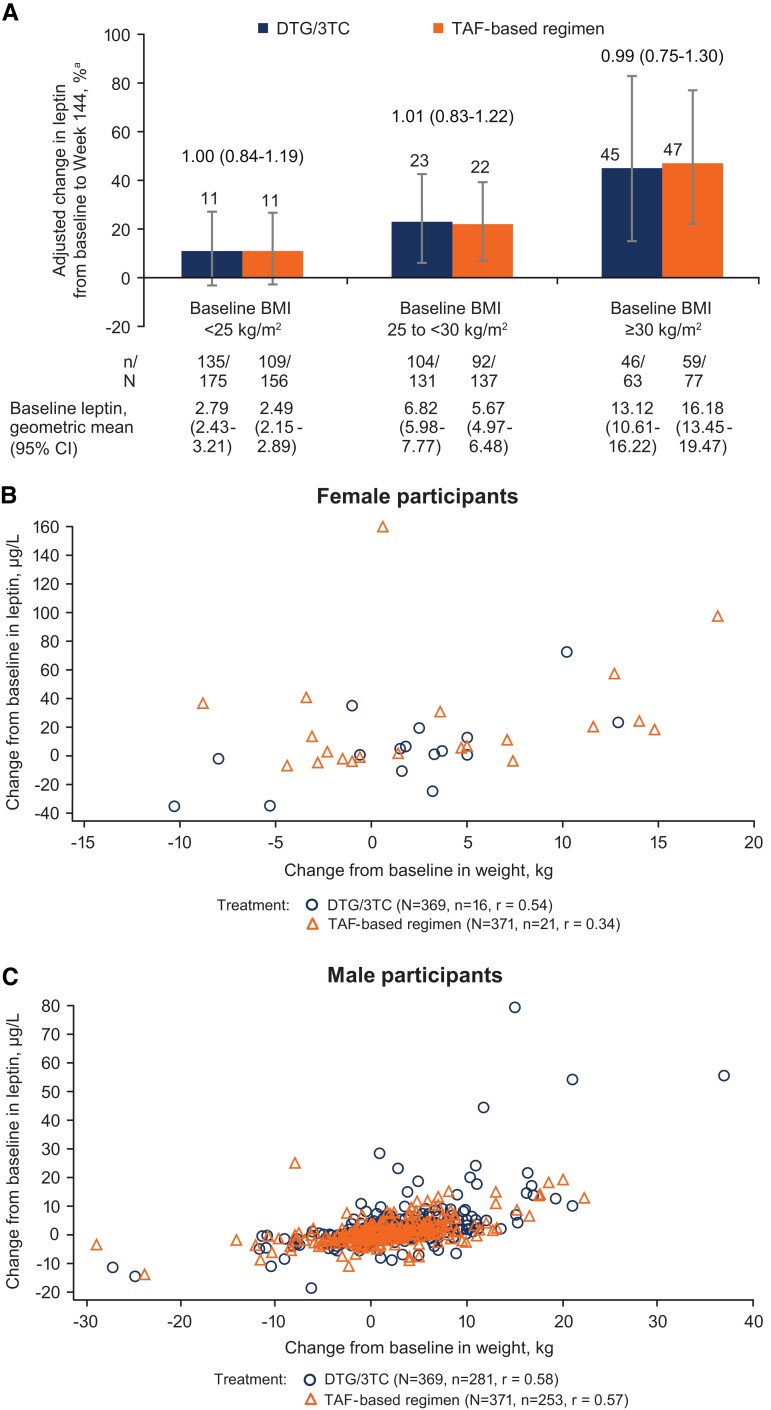
Figure 2.
(A) Adjusted percentage change from baseline in leptin and correlation between change from baseline in leptin and body weight in (B) female and (C) male participants (post hoc analysis). BMI, body mass index; DTG, dolutegravir; TAF, tenofovir alafenamide; 3TC, lamivudine. aPercentage change from baseline and 95% CI based on adjusted ratio (week 144 to baseline) in each group were calculated via a mixed-model repeated measures analysis applied to change from baseline in loge-transformed data, adjusting for the following: treatment, baseline BMI category, baseline third agent class, prior TAF duration (continuous), loge-transformed baseline leptin (continuous), baseline insulin (continuous), baseline CD4+ cell count (continuous), age (continuous), sex, treatment × visit, loge-transformed baseline leptin × visit, treatment × baseline BMI category, baseline BMI category × visit, and baseline BMI category × treatment × visit—with visit as the repeated factor. Treatment ratio (95% CI) is shown above the bars in panel A.

