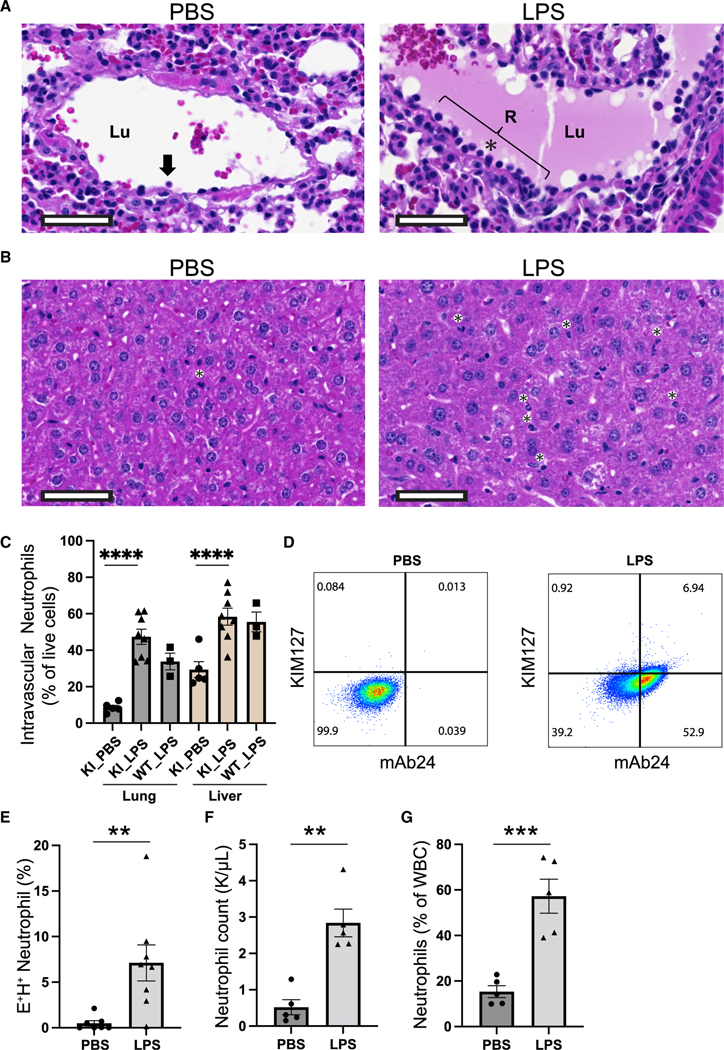
Figure 6. LPS-induced integrin activation in sepsis.
(A and B) Representative H&E photomicrographs of lung (A) and liver (B) tissues from hITGB2 KI mice 6 h after treatment with PBS or LPS. Both lungs and livers were evaluated by a board-certified pathologist. The black arrow or asterisk indicates neutrophils. Lu, lumen; R, area of nucleated cells. Scale bar, 50 μm.
(C) Intravascular neutrophils in total isolated live cells in lung and liver of hITGB2 KI or control WT mice analyzed by FACS. Anti-CD45 was injected intravenously to stain intravascular neutrophils.
(D) Flow-cytometric analysis of integrin activation in whole blood of hITGB2 KI mice after treatment with PBS or LPS.
(E) () neutrophils were quantified as mean ± SEM of 7 and 8 mice in PBS and LPS treatment, respectively.
(F and G) Neutrophil count (F) and percentage of neutrophils among total white blood cells (WBCs, G) were measured by Hemavet. Mean ± SEM of 5 mice in PBS and LPS treatment, respectively.
In (C), we performed a one-way ANOVA followed by Tukey’s multiple comparison test; in (E)–(G), we performed unpaired Student’s t tests. In all tests, **p < 0.01; ***p < 0.001; and ****p < 0.0001.

