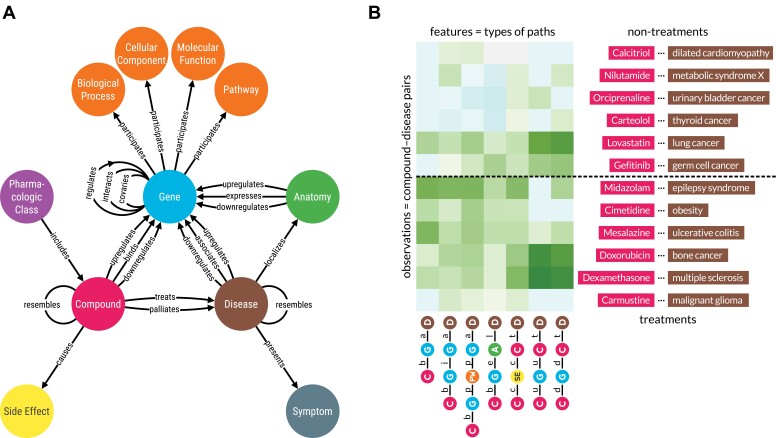
Figure 1:
(A) Hetionet v1.0 metagraph. The types of nodes and edges in Hetionet. (B) Supervised machine learning approach from Project Rephetio. This figure visualizes the feature matrix used by Project Rephetio to make supervised predictions. Each row represents a compound–disease pair. The bottom half of rows correspond to known treatments (i.e., positives), while the top half correspond to nontreatments (i.e., negatives under a closed-world assumption, not known to be treatments in PharmacotherapyDB). Here, an equal number of treatments and nontreatments are shown, but in reality, the problem is heavily imbalanced. Project Rephetio scaled models to assume a positive prevalence of 0.36% [2, 4]. Each column represents a metapath, labeled with its abbreviation. Feature values are degree-weighted path counts (abbreviated DWPCs, transformed and standardized), which assess the connectivity along the specified metapath between the specific compound and disease. Green values indicate above-average connectivity, whereas blue values indicate below-average connectivity. In general, positives have greater connectivity for the selected metapaths than negatives. Rephetio used a logistic regression model to learn the effect of each type of connectivity (feature) on the likelihood that a compound treats a disease. The model predicts whether a compound–disease pair is a treatment based on its features but requires supervision in the form of known treatments.

