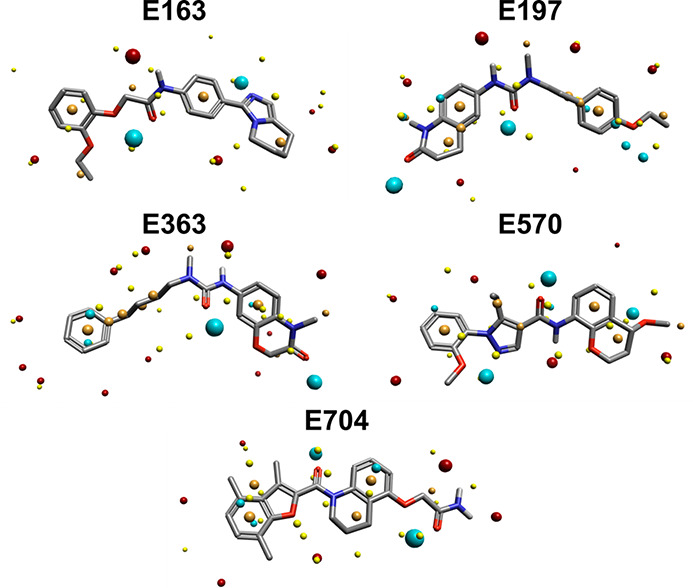
Figure 10.

Field points of E163, E197, E363, E570, and E704 aligned to Template 2. Blue field points describe regions of negative electrostatic potential; red field points describe regions of positive electrostatic potential; orange field points describe regions with high hydrophobicity; and yellow field points describe van der Waals interactions.
