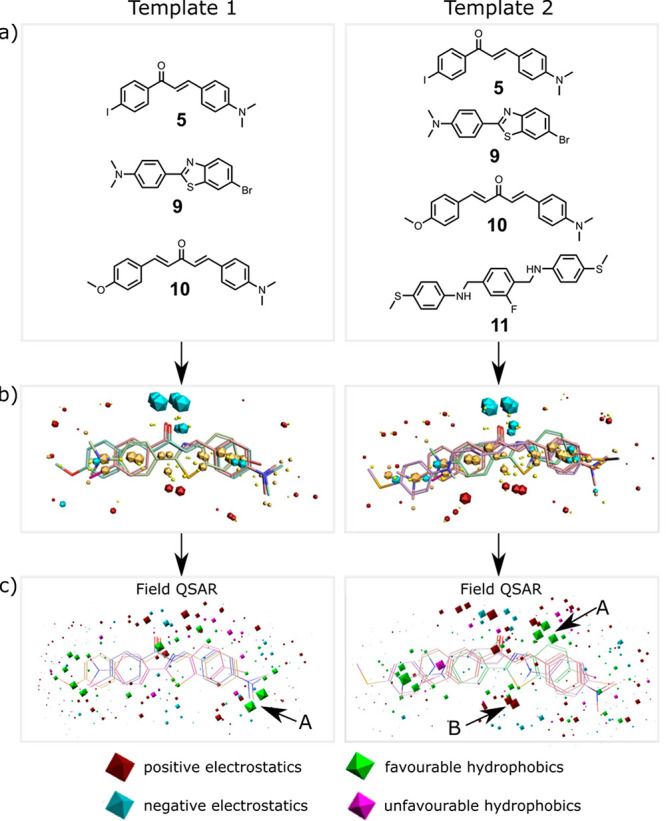
Figure 6.

Field point templates. (a) Reference ligands 5, 9, and 10 were used to construct Template 1, and 5, 9, 10, and 11 were used to construct Template 2. (b) 3D alignment of the reference ligands showing the field points (blue: negative electrostatic potential; red: positive electrostatic potential; orange: high hydrophobicity; yellow: van der Waals interactions). (c) Field-QSAR models shown relative to the reference ligands: blue sites describe regions where more negative or less positive electrostatic field coefficients favor affinity; red sites describe regions where less negative or more positive electrostatic field coefficients favor affinity; green sites describe regions where hydrophobes favor affinity; pink sites describe regions where hydrophobes disfavor affinity. The sites labeled A represent regions where hydrophobic interactions are important, and the site labeled B highlights important electrostatic interactions.
