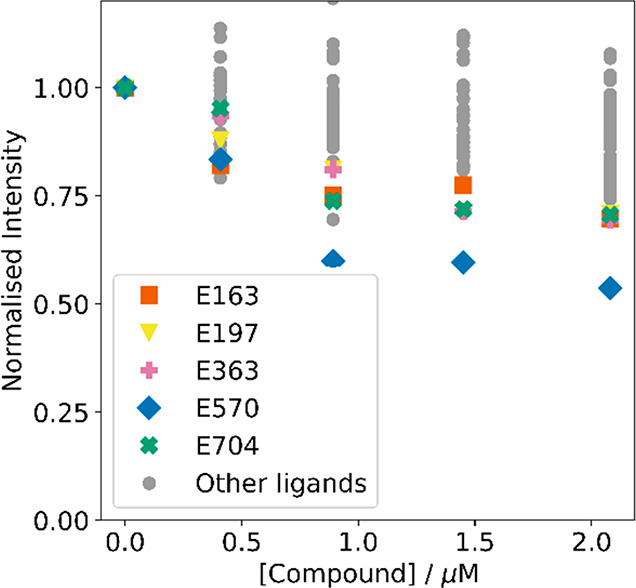
Figure 8.

ThT competition assay for 44 compounds from the VS pipeline. Increasing concentrations of each compound were added to Aβ(1–42) fibrils (250 nM) and ThT (1.0 μM) in 1× PBS buffer (pH 7.4, 25 °C). Fluorescence spectra were recorded using λex = 440 nm, and the emission intensity was monitored at λem = 483 nm. Gray data points denote low-affinity compounds that were not investigated further.
