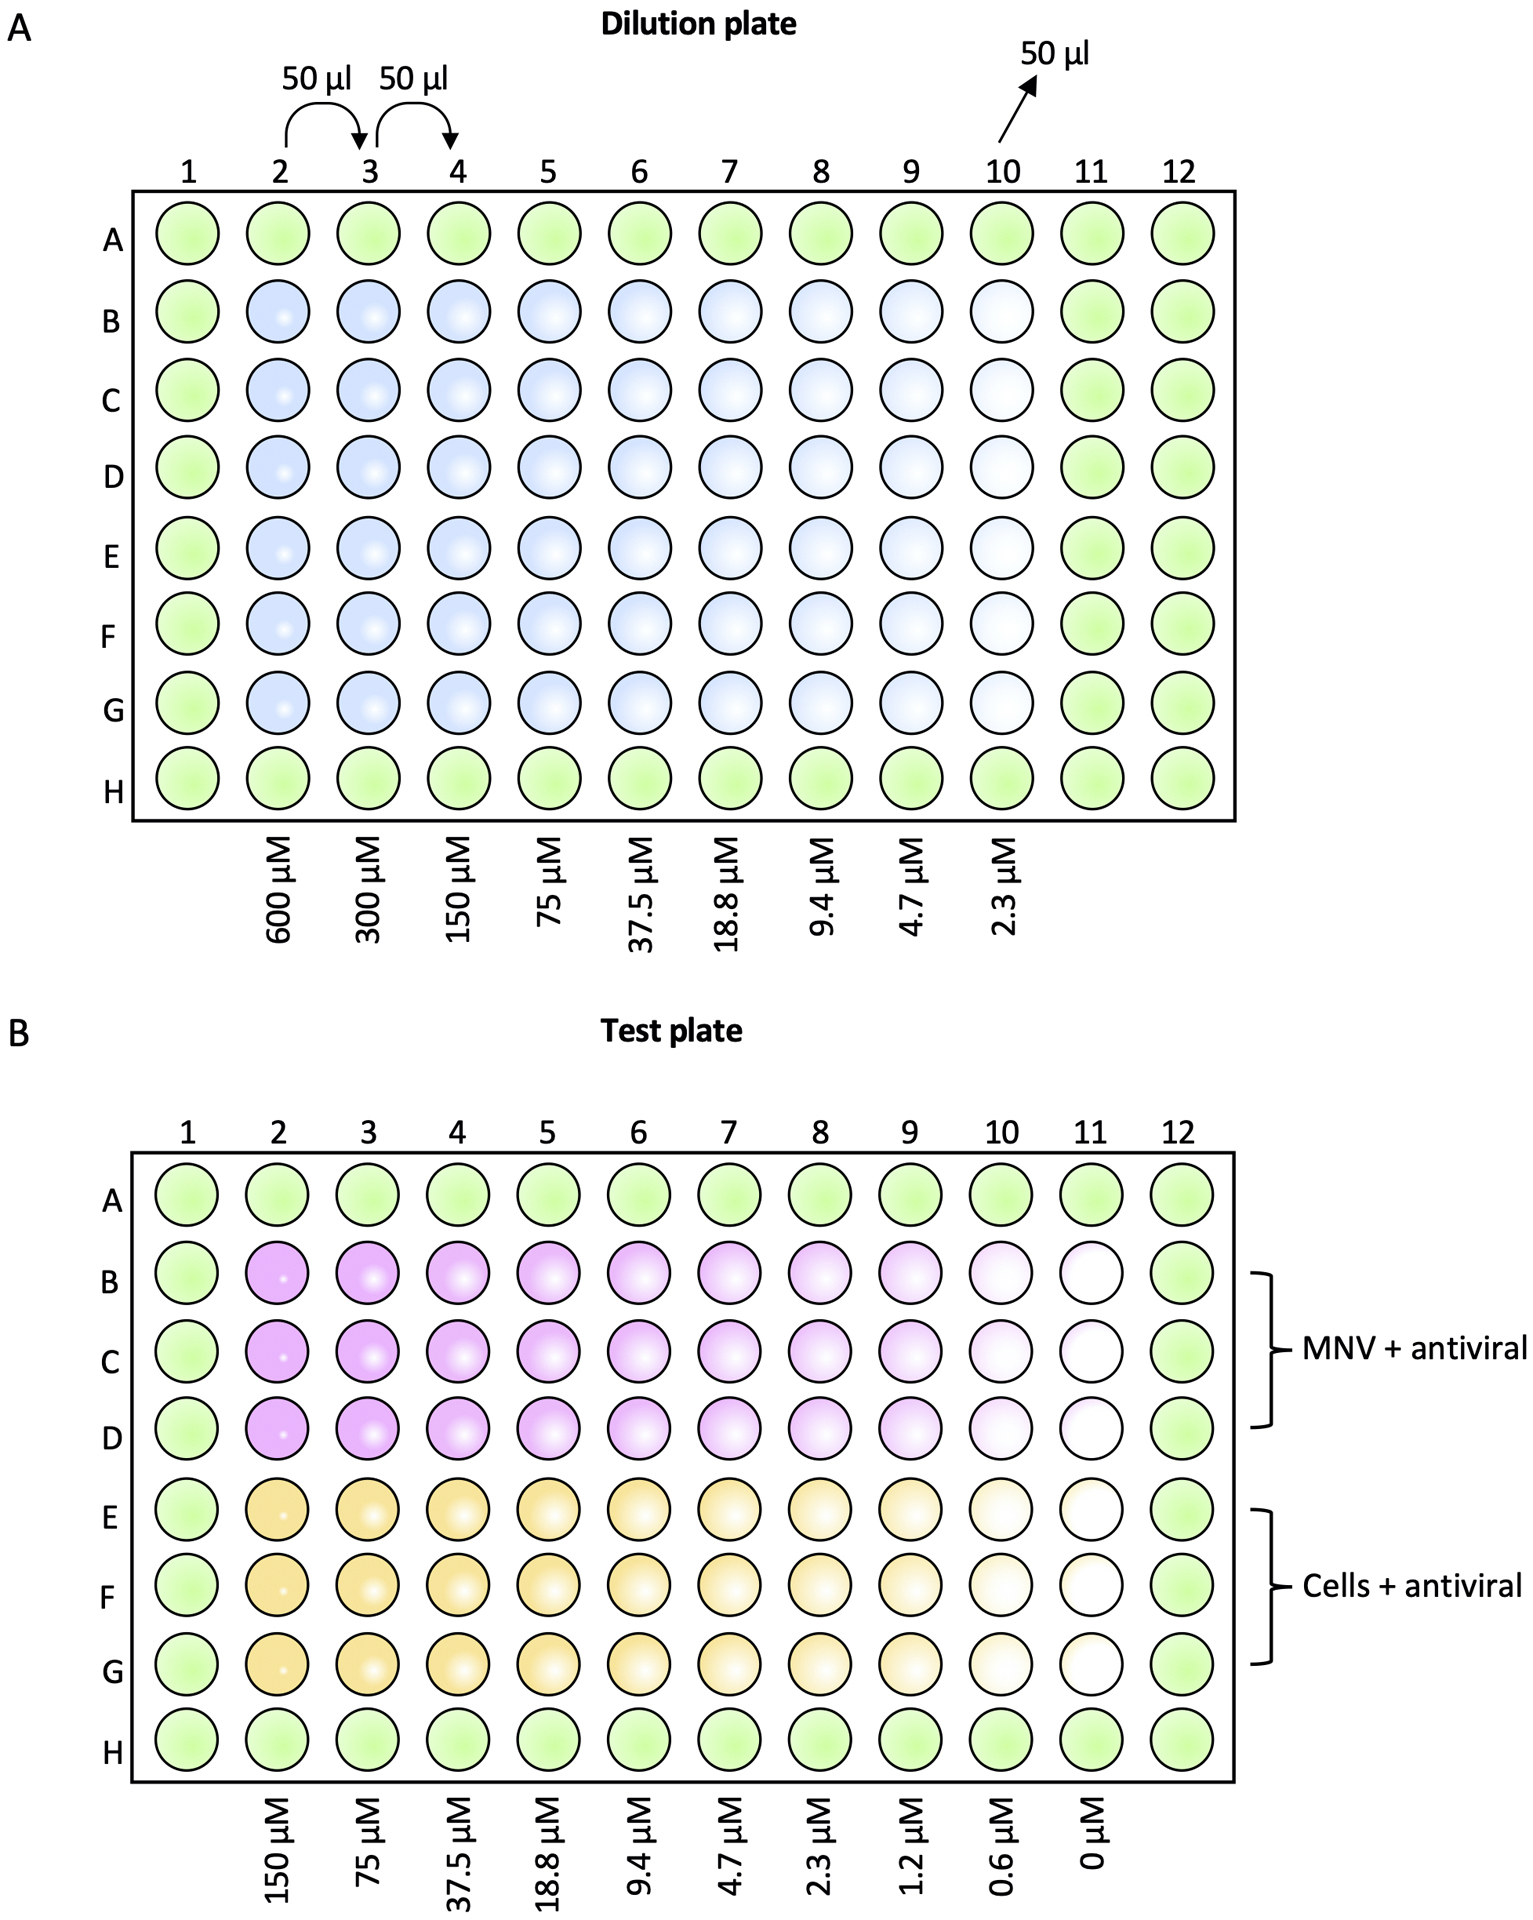
Figure 1:

Preparation of the inhibitor dilution (A) and test (B) plates. Wells in green contain only DMEM-10. (A) Wells in blue contain dilutions of the inhibitor at the indicated concentrations. (B) Pink indicates wells containing RAW 264.7 cells, MNV and a 2-fold dilution series of inhibitor, for measuring antiviral effects. Yellow indicates wells containing RAW 264.7 cells and a 2-fold serial dilution of inhibitor, for measuring cell cytotoxicity. Inhibitor concentrations range from 150 μM to 0.6 μM with a 0 μM cells only control and virus only control.
