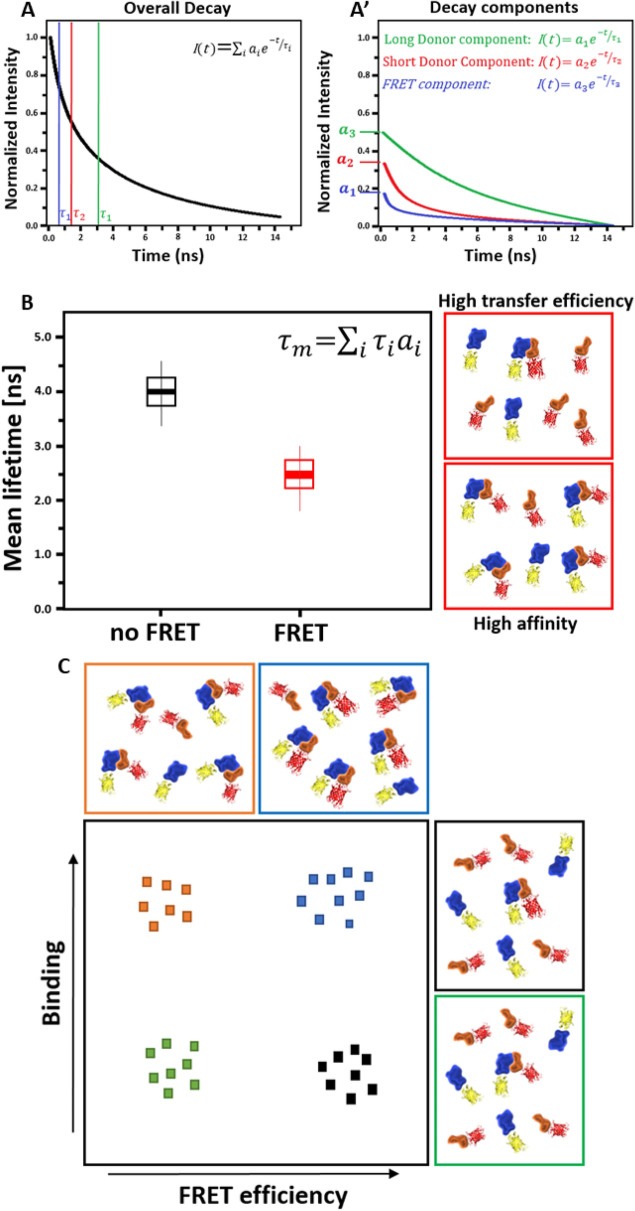
Fig. 2.
BINDING and FRET efficiency in FLIM experiments. A Schematic of a multiexponential fluorescence decay when FRET occurs. Fluorescence lifetime τ is defined as the average time a fluorophore stays in its excited state. During this time, the intensity I(t) decreases by 63.8%. The decaying intensity at time t is given by the summed decay functions across all components i, where is the lifetime and the pre-exponential factor (amplitude) of the exponential decay function. A’ Schematic of the different components in the overall decay. The sum of the individual components would result in the overall decay curve. B The mean amplitude weighted lifetime of a mixture of differentially decaying components is given by the sum of each component’s lifetime () weighted by its respective amplitude (). In case of FRET, decreases and can be used as a measure for protein–protein interaction. However, reduction of ccould be due to high affinity between the proteins and low energy transfer efficiency between fluorophores or vice versa. Therefore, using , one loses information which are usually included in FLIM data. C Using the amplitudes and the lifetimes of the exponential decay, BINDING and FRET efficiency can be calculated. BINDING is indicative of how many molecules undergo FRET in a sample, whereas FRET efficiency describes the efficiency of the energy transfer between the fluorophores. As energy transfer efficiency is dependent on the distance between fluorophores and the orientation of their dipoles, FRET efficiency can be used as a measure for proximity and orientation within the complex and BINDING as an indicator for the affinity between the proteins. Increase of BINDING correlates with more protein–protein interactions. Increase in FRET efficiency indicates higher transfer efficiency due to higher proximity of the fluorophores and similar orientation of their dipoles

